Industrial Properties
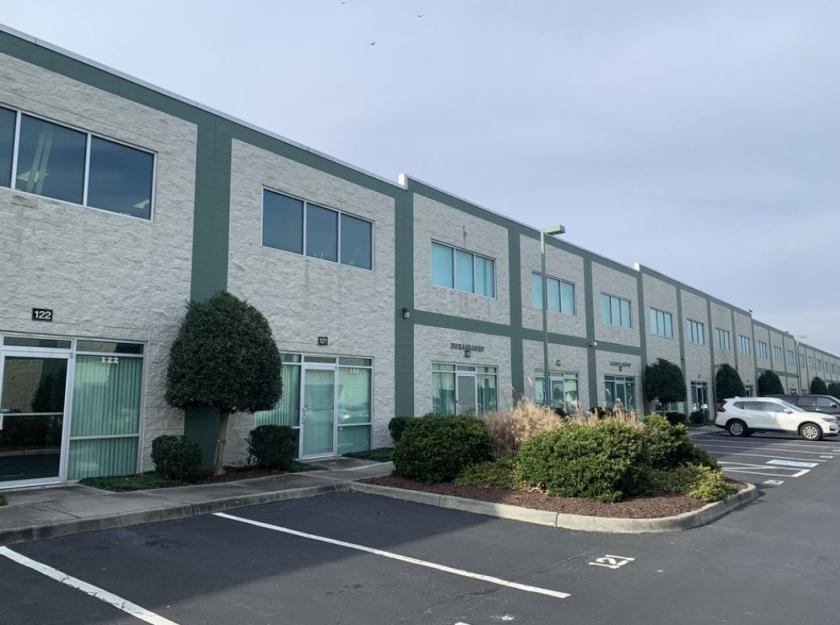
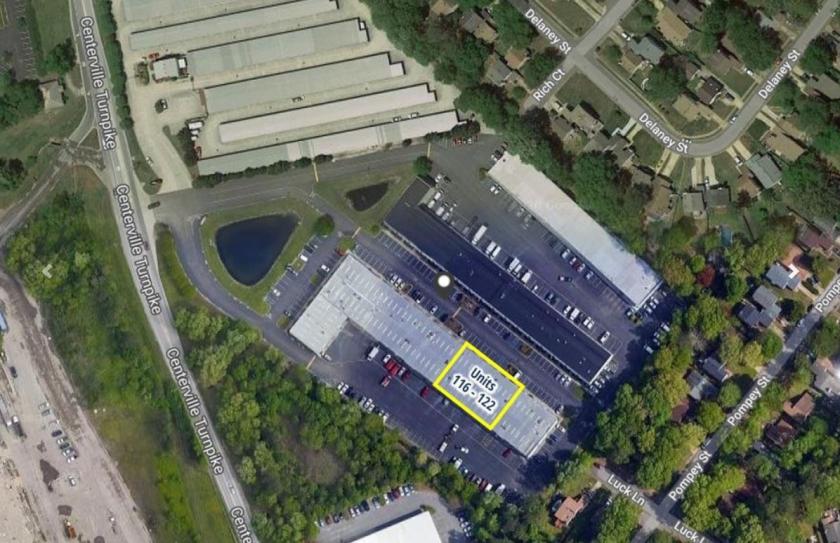
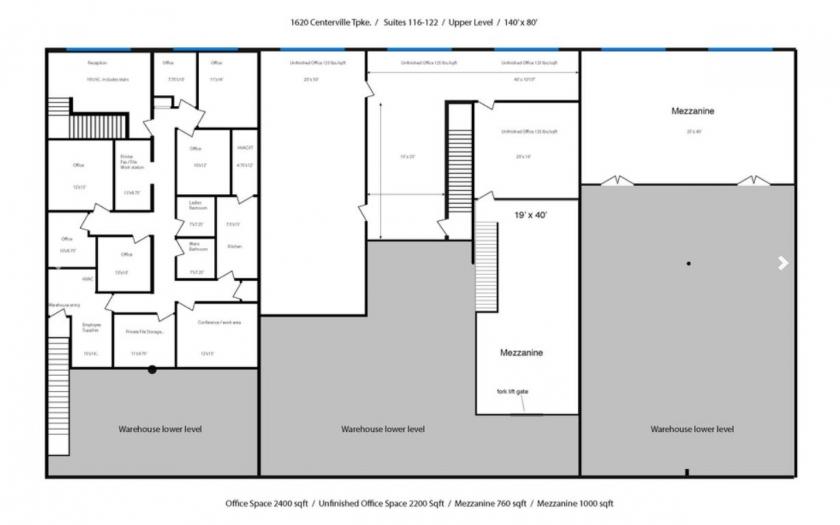
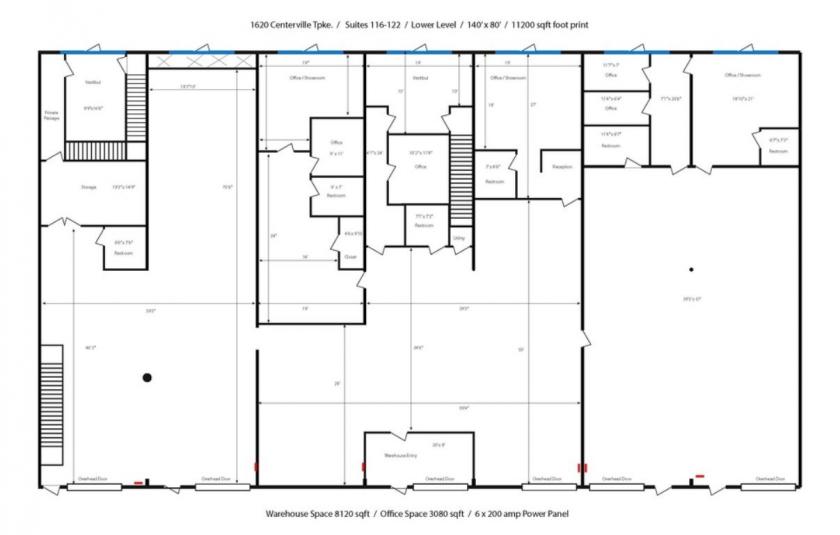
1620 Centerville Turnpike Virginia Beach, VA 23464
1620 Centerville Turnpike Virginia Beach, VA 23464
Details & Description
Additional Photos
Listing Agents

Ben Leon
O: 757-640-2272
M: 757-469-2365
bleon@slnusbaum.com
O: 757-640-2272
M: 757-469-2365
bleon@slnusbaum.com
While we strive to provide the most accurate information, all listing information, and demographic data, is provided by third-parties. As such, MyEListing will not be responsible for the accuracy of the information. It is strongly recommended that you verify all information with the listing agent, and any relevant agencies, prior to making any decisions.


