This downtown Bronxville movie theater space is new for lease. It is currently built-out as a movie theater; however, other retail and entertainment opportunities are being considered. Additionally, this is a fully equipped venue that is impossible to duplicate.
A LONG STANDING HISTORY SINCE 1926
The Bronxville movie theater has been operating since its opening on September 1, 1926. As Bronxville Mayor Mary Marvin states, “…this theater benefit[s] us as residents (I cannot tell you how many nights, especially Tuesdays, I have enjoyed seeing a first-run movie and then being able to walk home), but the theater also brings in people from so many surrounding communities who then have a drink or dinner or an ice cream cone and window shop…”
AN ABUNDANCE OF OPPORTUNITY
While keeping this long-standing Bronxville staple as a theater or entertainment space would be widely celebrated by the community, the zoning also allows for general retail, office/medical, and fitness. The potential for food expands the use even more. The possibilities are endless and beyond creative.
VENUE DETAILS
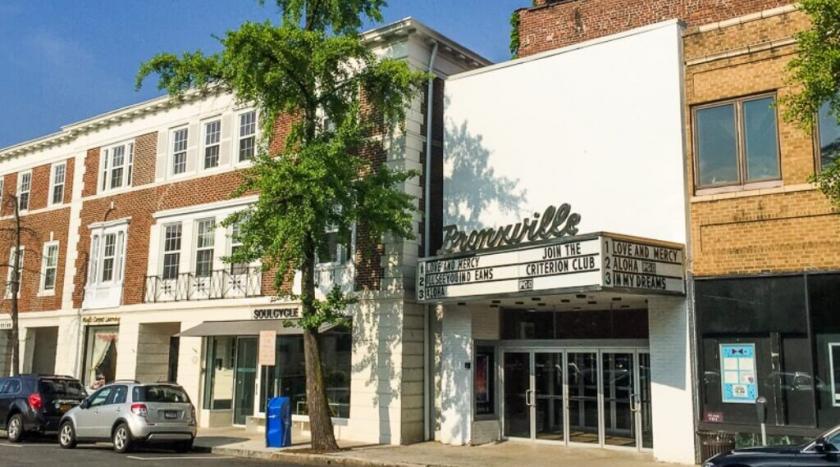
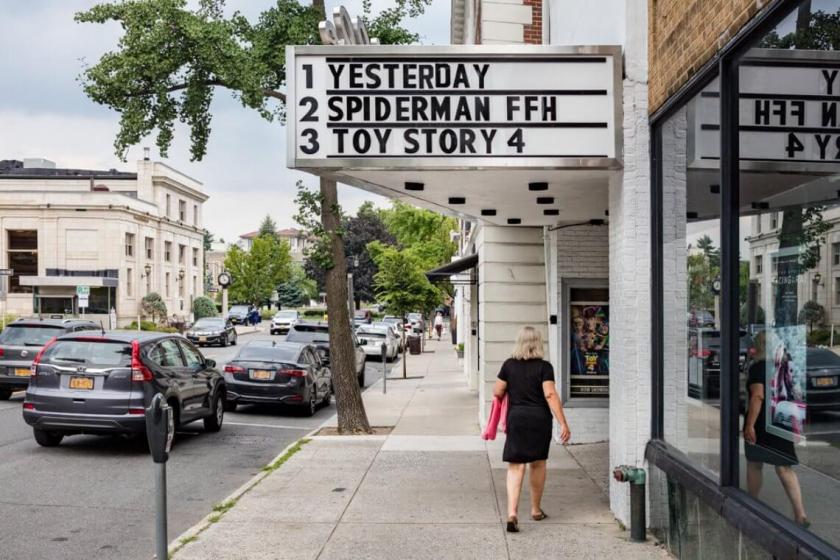
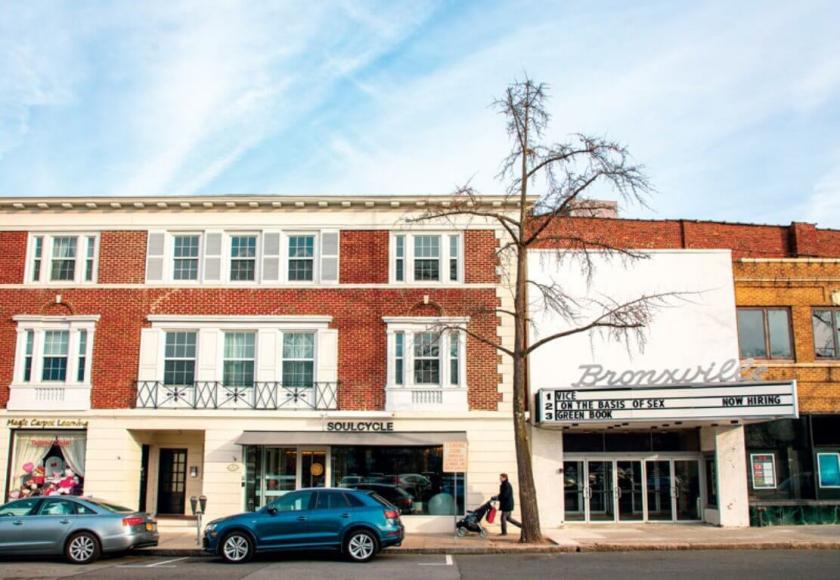
To start, the space features a beautiful and rare “Bronxville” marquee, which is visibly prominent on Kraft Avenue. Further, the location is situated directly across from the Bronxville Metro-North train. More, there is over 42 feet of frontage and adjacent to the very popular SoulCycle. Other extremely walkable restaurants and businesses include Tredici Social, Starbucks, Underhills Crossing, Haagen Dazs, Beer Noggin, The Bronxville Diner, Bluemercury, Bronxville Running Company, and Candy Rox, to name a few.
This 16,372 square foot space has three (3) screens between two (2) levels. The electric capacity is set up on 800 amps/3-phase. Additionally, all theater equipment is in place.
CENTRALLY LOCATED
This theater space is centrally located within the village of Bronxville. It is located in the Central Business District on Kraft Avenue between Pondfield and Road Park Place. As mentioned, the Bronxville Metro-North train station is just across the street and bus stations are also lined along Kraft Avenue.
On a larger scale, Bronxville is centrally located in southern Westchester. Neighboring towns such as Scarsdale, Eastchester, Tuckahoe, Yonkers, New Rochelle, and Larchmont are a quick car or train ride away. Further, Bronxville is hugged by the Bronx River Parkway, the Sprain Brook Parkway and the Hutchinson River Parkway. Other major routes include White Plains Road and the Cross County Parkway making Bronxville extremely accessible.
QUICK FACTS
16,372 SF | Fully Built-Out
(3) Theaters | (2) Levels | 800 Amps/3-Phase
All Theater Equipment in Place
Lot & Street Metered Parking Options
Uses – Theater, Entertainment, Retail, Office/Medical, Fitness
Located in the Heart of Downtown Bronxville b/w Pondfield Rd & Cedar St
Public Transportation: Across from Metro-North & Bus Stop
District: Downtown Business 1