? PRICE: $.80 psf - Industrial Gross
? +/- 11,345 sf steel structure warehouse building
? Divisible/Flexible
? +/- .65 acre fenced parcel
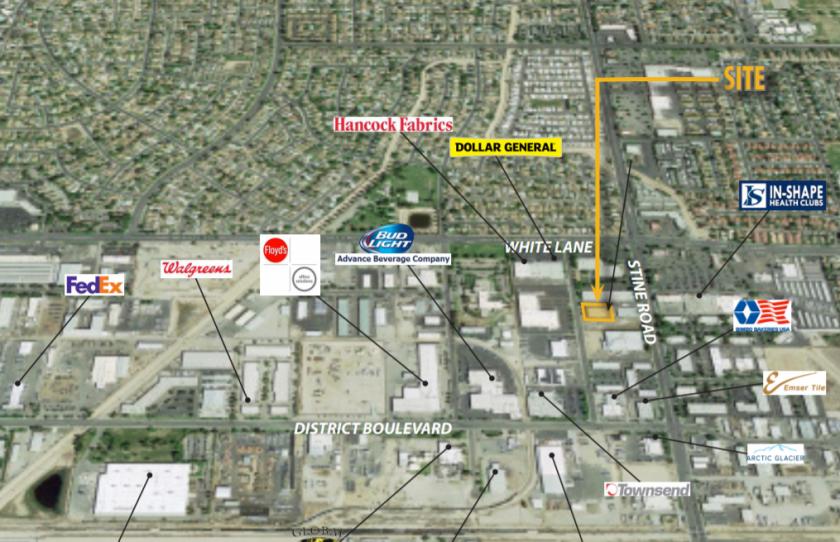
? Located in the Stockdale Industrial Park
? Zoned M-1 City of Bakersfield
? Three 16’x16’ roll-up doors
? Additional mezzanine storage
? Full sprinkler system
? HVAC in office areas
? Reception area, three private offices, break room, storage room, office and warehouse restrooms
? 120/208 3-phase 400 amp
No part of this information may be copied, reproduced, repurposed, or screen-captured for any commercial purpose without prior written authorization from MyEListing.
While we strive to provide the most accurate information, all listing information, and demographic data, is provided by third-parties. As such, MyEListing will not be responsible for the accuracy of the information. It is strongly recommended that you verify all information with the listing agent, and any relevant agencies, prior to making any decisions.
What is the building size of this commercial Industrial property?
The size of this lease property at '.4320 Shepard Street.' is 11000 square feet
What kind of Industrial is the propery at 4320 Shepard Street?
The property at 4320 Shepard Street Bakersfield, CA 93313 is listed as a Warehouse Industrial property
What is the population within 1 mile of 4320 Shepard Street in Bakersfield?
The population within 1 mile of 4320 Shepard Street Bakersfield, CA 93313 is 16,483 people.
Who do I contact for questions about 4320 Shepard Street?
You should contact the listing agent,
Steve Adams, for any details regarding this commercial listing.