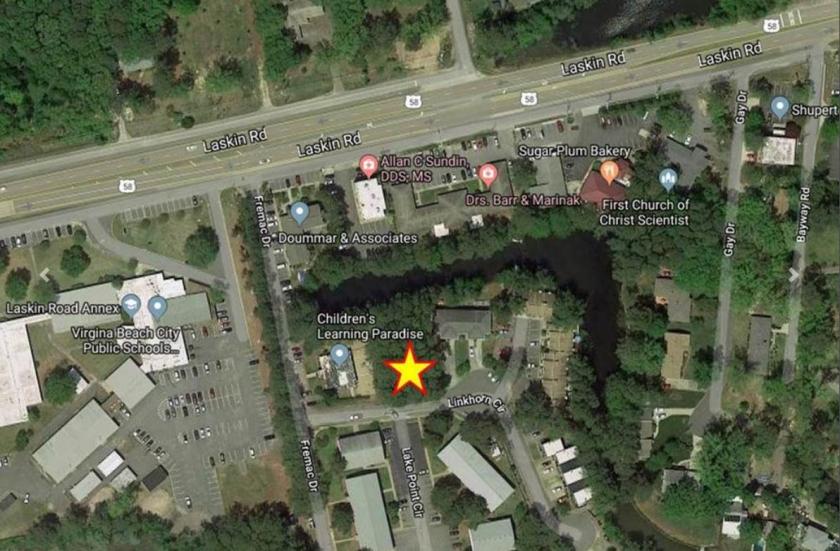
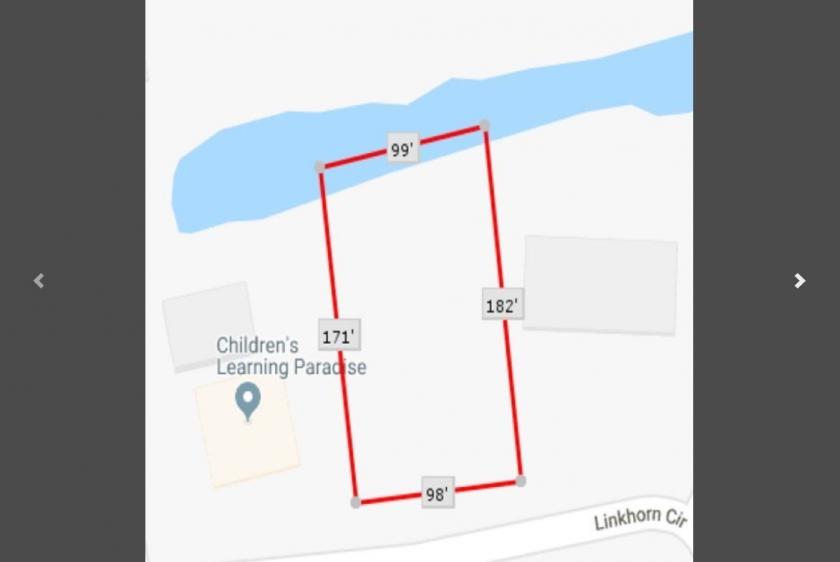
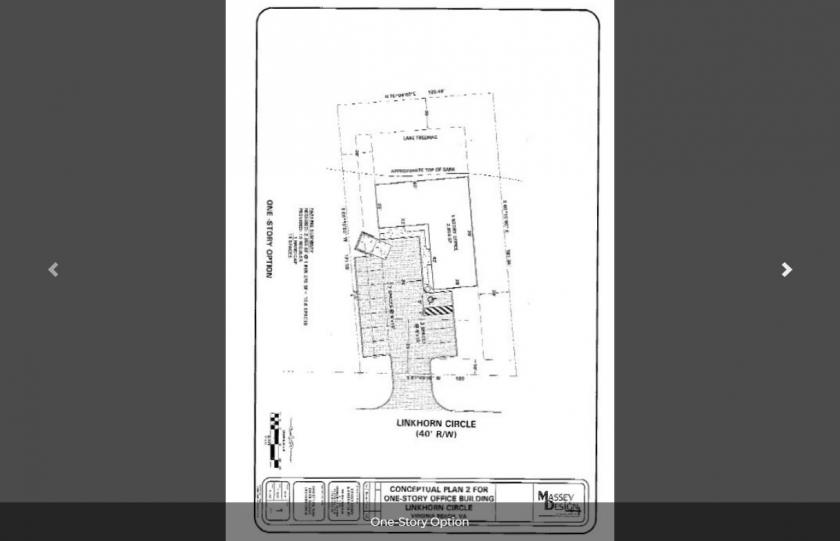
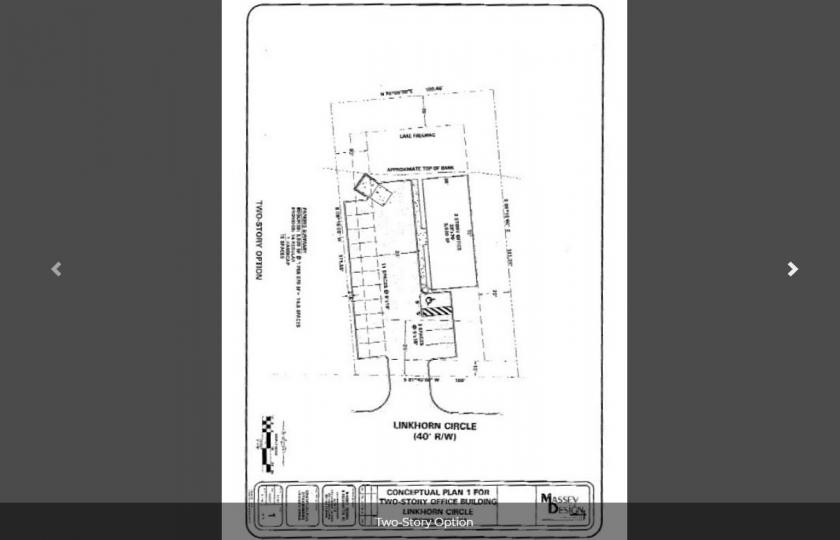
1-Mile | 3-Miles | 5-Miles | ||
---|---|---|---|---|
Total Population | 12,403 | 65,444 | 122,836 | |
Population Median Age | 36 | 39 | 39 | |
Population by Age | 0-9 Yrs | 1138 (9%) | 6793 (10%) | 13320 (10%) |
10-19 Yrs | 1210 (9%) | 7684 (11%) | 15303 (12%) | |
20-29 Yrs | 3414 (27%) | 11564 (17%) | 20210 (16%) | |
30-39 Yrs | 2153 (17%) | 9146 (13%) | 16480 (13%) | |
40-49 Yrs | 1208 (9%) | 7583 (11%) | 14557 (11%) | |
50-59 Yrs | 1334 (10%) | 8772 (13%) | 16589 (13%) | |
60-69 Yrs | 1047 (8%) | 7263 (11%) | 13937 (11%) | |
70+ Yrs | 898 (7%) | 6639 (10%) | 12441 (10%) | |
Median HH Income | $55,863 | $70,328 | $74,807 | |
Total Household Income | < 24K | 867 (15%) | 3599 (12%) | 5421 (10%) |
25-49K | 1680 (29%) | 6217 (22%) | 10318 (20%) | |
50-74K | 1227 (21%) | 5196 (18%) | 8974 (18%) | |
75-99K | 744 (12%) | 3821 (13%) | 6863 (13%) | |
100-199K | 827 (14%) | 6423 (22%) | 12386 (25%) | |
200K+ | 391 (6%) | 2887 (10%) | 5326 (10%) | |
Highest Education Level | No Diploma | 530 | 2599 | 5233 |
Diploma or GED | 1759 | 8030 | 15555 | |
Some College | 2222 | 10269 | 19390 | |
Assoc. Degree | 1116 | 4526 | 8636 | |
Bachelors Degree | 1576 | 12089 | 21360 | |
Higher Degree | 1123 | 7532 | 14290 | |
Total Housing Units | 6,463 | 32,200 | 54,885 | |
--Owner-Occupied | 1,784 | 14,586 | 29,073 | |
--Renter-Occupied | 3,954 | 13,558 | 20,215 | |
Owner-Occupied Values | < 100K | 49 | 427 | 1210 |
100-199K | 361 | 2175 | 4187 | |
200-299K | 530 | 2403 | 5911 | |
300-399K | 354 | 2655 | 5049 | |
400-499K | 70 | 2275 | 3491 | |
500K+ | 419 | 4651 | 9224 | |
Total Working Age Population | 10,548 | 53,894 | 100,266 | |
In Work Force | 8,163 | 38,412 | 70,207 | |
Not In Work Force | 2,385 | 15,482 | 30,059 | |
Workforce Employed | 7,195 | 33,357 | 60,481 | |
Workforce Unemployed | 416 | 1,662 | 2,797 | |
Civlian Workforce | 7,612 | 35,018 | 63,278 | |
Military Workforce | 551 | 3,393 | 6,929 | |
Total Households | 5,737 | 28,144 | 49,288 | |
Family Households | 2,894 | 16,623 | 31,974 | |
Non-Family Households | 2,844 | 11,521 | 17,314 | |
Married Couple | 1,813 | 11,650 | 23,831 | |
Other Family | 1,080 | 4,973 | 8,143 | |
Married w/Child | 603 | 3,989 | 8,962 | |
Single Male w/Child | 207 | 963 | 1,441 | |
Single Female w/Child | 493 | 2,214 | 3,322 |
Population Change Last Two Decades - Plus Projection
2000 | % | 2010 | % | 2020 | % | 2030 | |
---|---|---|---|---|---|---|---|
Virginia | 7,078,515 | +13 | 8,001,024 | +8 | 8,655,021 | +8 | 9,331,666 |
Chesapeake city | 199,184 | +12 | 222,209 | +12 | 249,244 | +9 | 270,506 |
Virginia Beach city | 425,257 | +3 | 437,994 | +4 | 457,699 | +2 | 467,187 |
Total Working Age Population:
Total Households:
Total Working Age Population:
Total Households:
Total Working Age Population:
Total Households: