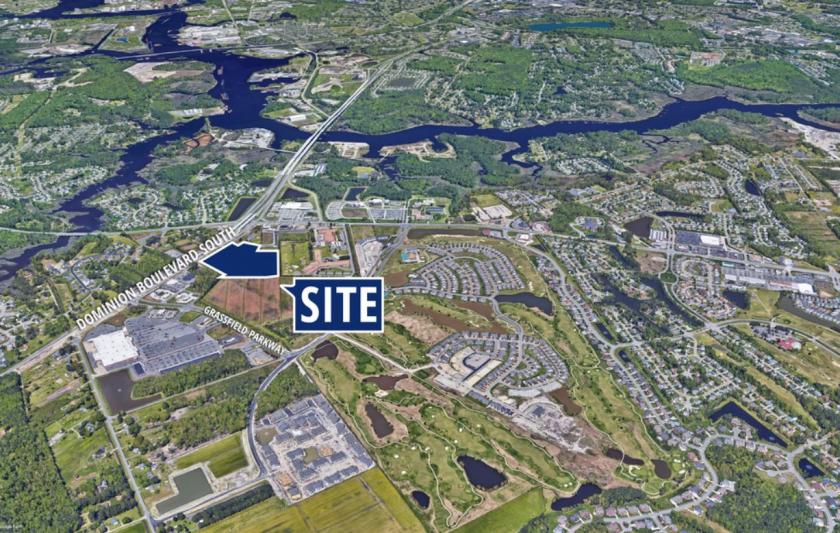
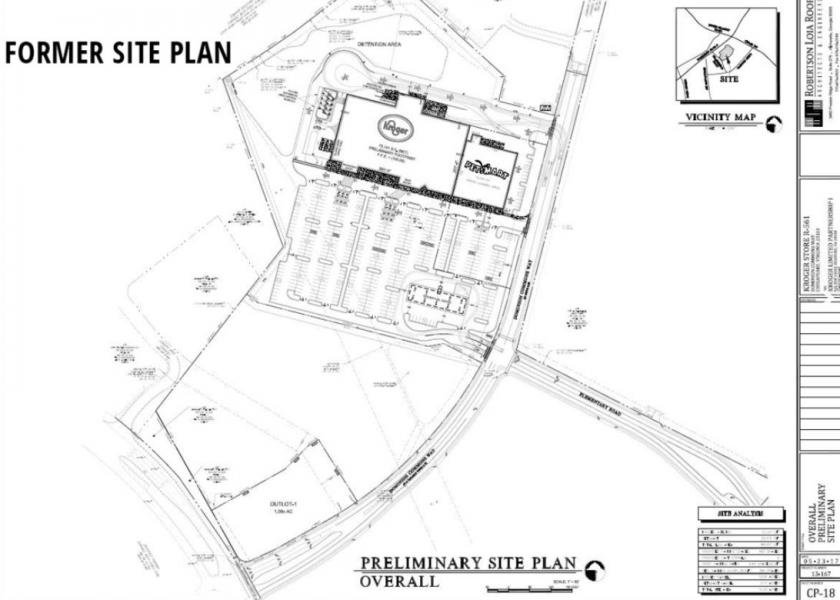
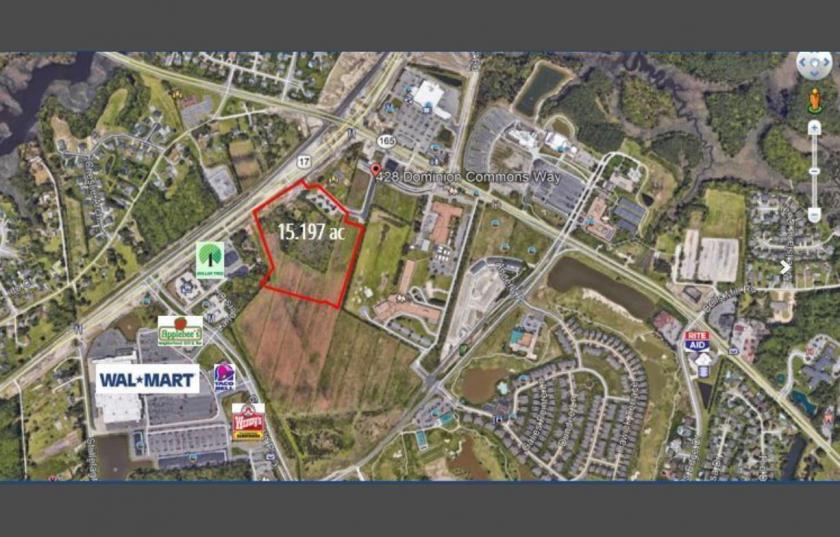
1-Mile | 3-Miles | 5-Miles | ||
---|---|---|---|---|
Total Population | 4,492 | 45,784 | 108,232 | |
Population Median Age | 39 | 37 | 37 | |
Population by Age | 0-9 Yrs | 556 (12%) | 6348 (13%) | 14787 (13%) |
10-19 Yrs | 642 (14%) | 6619 (14%) | 14070 (12%) | |
20-29 Yrs | 447 (9%) | 5386 (11%) | 14793 (13%) | |
30-39 Yrs | 539 (11%) | 6270 (13%) | 16053 (14%) | |
40-49 Yrs | 695 (15%) | 6371 (13%) | 13179 (12%) | |
50-59 Yrs | 659 (14%) | 6390 (13%) | 15279 (14%) | |
60-69 Yrs | 488 (10%) | 4830 (10%) | 10743 (9%) | |
70+ Yrs | 466 (10%) | 3569 (7%) | 9329 (8%) | |
Median HH Income | $110,462 | $93,677 | $79,248 | |
Total Household Income | < 24K | 86 (5%) | 1467 (9%) | 4737 (12%) |
25-49K | 174 (10%) | 2224 (13%) | 6839 (17%) | |
50-74K | 210 (12%) | 2733 (17%) | 6922 (17%) | |
75-99K | 208 (12%) | 2147 (13%) | 5575 (14%) | |
100-199K | 790 (48%) | 5893 (36%) | 11831 (30%) | |
200K+ | 152 (9%) | 1593 (9%) | 2987 (7%) | |
Highest Education Level | No Diploma | 97 | 1444 | 5339 |
Diploma or GED | 575 | 6244 | 17081 | |
Some College | 779 | 7546 | 18533 | |
Assoc. Degree | 237 | 3042 | 7198 | |
Bachelors Degree | 827 | 7167 | 15588 | |
Higher Degree | 589 | 4583 | 8797 | |
Total Housing Units | 1,633 | 16,610 | 41,193 | |
--Owner-Occupied | 1,287 | 12,198 | 27,227 | |
--Renter-Occupied | 333 | 3,859 | 11,664 | |
Owner-Occupied Values | < 100K | 11 | 318 | 1530 |
100-199K | 40 | 1669 | 5556 | |
200-299K | 335 | 3958 | 9123 | |
300-399K | 618 | 4239 | 7240 | |
400-499K | 124 | 1270 | 2338 | |
500K+ | 159 | 744 | 1440 | |
Total Working Age Population | 3,619 | 35,676 | 84,912 | |
In Work Force | 2,536 | 23,577 | 57,049 | |
Not In Work Force | 1,083 | 12,098 | 27,863 | |
Workforce Employed | 2,285 | 21,127 | 51,419 | |
Workforce Unemployed | 114 | 1,060 | 2,455 | |
Civlian Workforce | 2,399 | 22,187 | 53,874 | |
Military Workforce | 137 | 1,390 | 3,175 | |
Total Households | 1,620 | 16,057 | 38,891 | |
Family Households | 1,318 | 12,306 | 28,645 | |
Non-Family Households | 302 | 3,751 | 10,246 | |
Married Couple | 1,118 | 9,694 | 21,338 | |
Other Family | 200 | 2,612 | 7,306 | |
Married w/Child | 492 | 4,515 | 8,874 | |
Single Male w/Child | 33 | 198 | 961 | |
Single Female w/Child | 100 | 1,258 | 3,241 |
Population Change Last Two Decades - Plus Projection
2000 | % | 2010 | % | 2020 | % | 2030 | |
---|---|---|---|---|---|---|---|
Virginia | 7,078,515 | +13 | 8,001,024 | +8 | 8,655,021 | +8 | 9,331,666 |
Chesapeake city | 199,184 | +12 | 222,209 | +12 | 249,244 | +9 | 270,506 |
Portsmouth city | 100,565 | -5 | 95,535 | -1 | 95,027 | -5 | 90,715 |
Virginia Beach city | 425,257 | +3 | 437,994 | +4 | 457,699 | +2 | 467,187 |
Total Working Age Population:
Total Households:
Total Working Age Population:
Total Households:
Total Working Age Population:
Total Households: