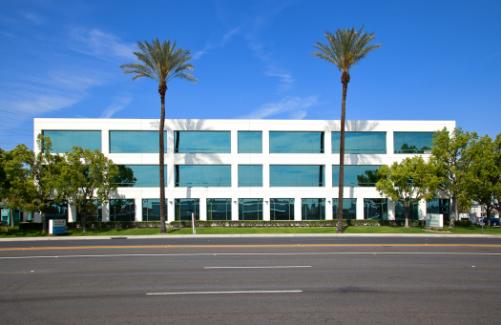
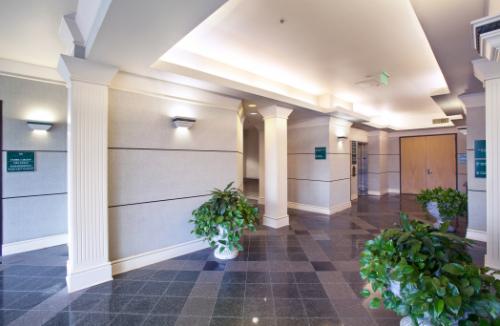
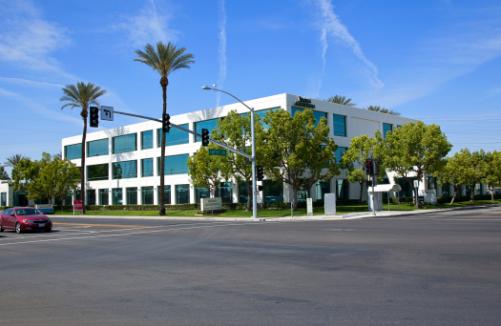
1-Mile | 3-Miles | 5-Miles | ||
---|---|---|---|---|
Total Population | 6,370 | 97,920 | 302,474 | |
Population Median Age | 37 | 35 | 34 | |
Population by Age | 0-9 Yrs | 685 (10%) | 15864 (16%) | 50920 (16%) |
10-19 Yrs | 793 (12%) | 13608 (13%) | 45352 (14%) | |
20-29 Yrs | 1222 (19%) | 17614 (17%) | 50581 (16%) | |
30-39 Yrs | 1118 (17%) | 13939 (14%) | 41293 (13%) | |
40-49 Yrs | 613 (9%) | 9549 (9%) | 32519 (10%) | |
50-59 Yrs | 750 (11%) | 10324 (10%) | 32894 (10%) | |
60-69 Yrs | 616 (9%) | 8683 (8%) | 26776 (8%) | |
70+ Yrs | 572 (8%) | 8338 (8%) | 22140 (7%) | |
Median HH Income | $54,695 | $41,839 | $47,948 | |
Total Household Income | < 24K | 550 (21%) | 10700 (29%) | 26067 (26%) |
25-49K | 566 (22%) | 9708 (27%) | 25409 (25%) | |
50-74K | 705 (28%) | 6703 (18%) | 17772 (17%) | |
75-99K | 245 (9%) | 3186 (8%) | 10609 (10%) | |
100-199K | 358 (14%) | 4515 (12%) | 15608 (15%) | |
200K+ | 89 (3%) | 963 (2%) | 3923 (3%) | |
Highest Education Level | No Diploma | 626 | 12920 | 42341 |
Diploma or GED | 1485 | 17542 | 51853 | |
Some College | 1078 | 15251 | 43007 | |
Assoc. Degree | 405 | 4428 | 13348 | |
Bachelors Degree | 591 | 6837 | 20236 | |
Higher Degree | 288 | 3470 | 11053 | |
Total Housing Units | 2,661 | 38,946 | 107,442 | |
--Owner-Occupied | 1,058 | 14,440 | 46,852 | |
--Renter-Occupied | 1,455 | 21,336 | 52,535 | |
Owner-Occupied Values | < 100K | 98 | 2184 | 6099 |
100-199K | 319 | 5256 | 15986 | |
200-299K | 352 | 4466 | 14274 | |
300-399K | 150 | 1408 | 6097 | |
400-499K | 42 | 441 | 1910 | |
500K+ | 97 | 686 | 2486 | |
Total Working Age Population | 5,154 | 73,211 | 222,516 | |
In Work Force | 3,383 | 44,297 | 135,866 | |
Not In Work Force | 1,771 | 28,914 | 86,650 | |
Workforce Employed | 3,179 | 39,171 | 120,546 | |
Workforce Unemployed | 205 | 5,073 | 15,148 | |
Civlian Workforce | 3,383 | 44,244 | 135,695 | |
Military Workforce | 0 | 53 | 171 | |
Total Households | 2,513 | 35,776 | 99,387 | |
Family Households | 1,593 | 22,158 | 68,908 | |
Non-Family Households | 920 | 13,617 | 30,478 | |
Married Couple | 916 | 11,468 | 41,224 | |
Other Family | 678 | 10,691 | 27,684 | |
Married w/Child | 319 | 4,721 | 18,929 | |
Single Male w/Child | 88 | 1,664 | 4,181 | |
Single Female w/Child | 262 | 4,698 | 11,578 |
Population Change Last Two Decades - Plus Projection
2000 | % | 2010 | % | 2020 | % | 2030 | |
---|---|---|---|---|---|---|---|
California | 33,871,648 | +10 | 37,253,956 | +9 | 40,467,295 | +8 | 43,631,295 |
Kern County | 661,645 | +27 | 839,631 | +11 | 928,308 | +14 | 1,062,325 |
Total Working Age Population:
Total Households:
Total Working Age Population:
Total Households:
Total Working Age Population:
Total Households: