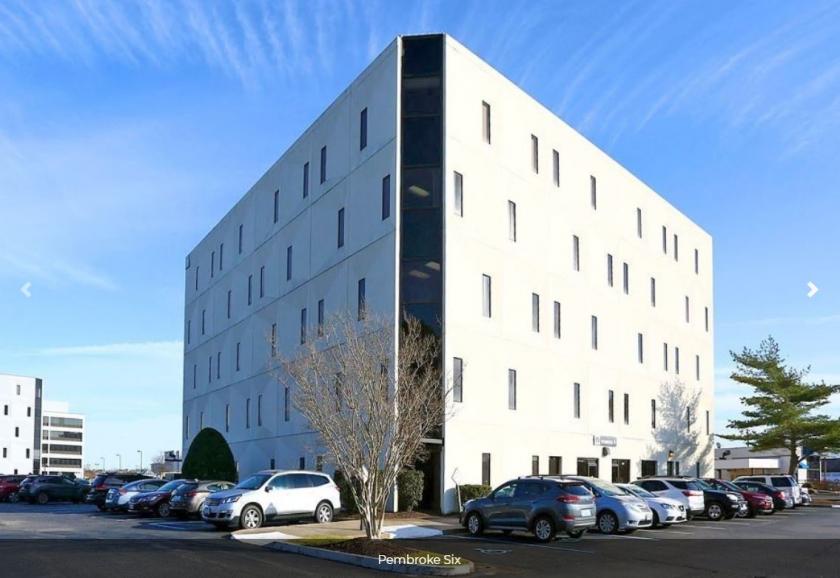
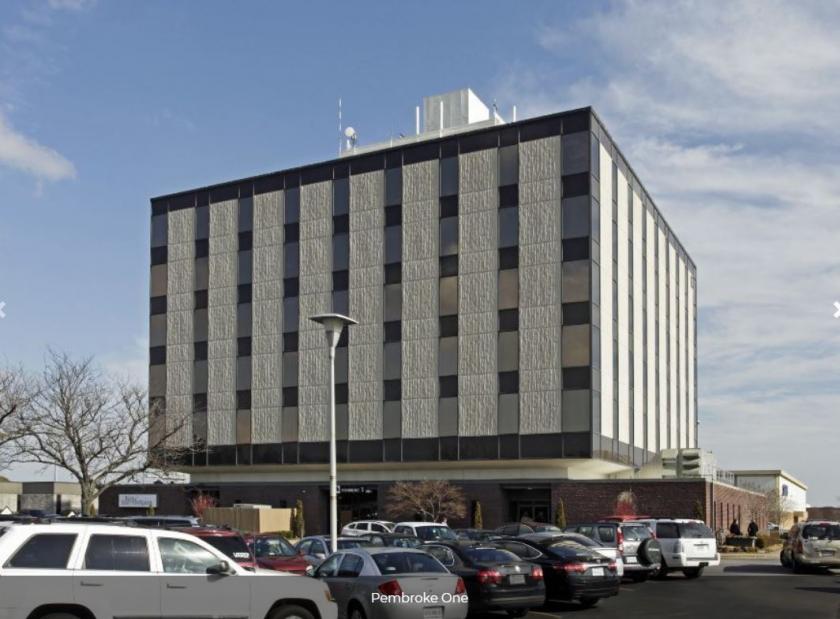
S.L. Nusbaum Realty Co. is pleased to present for sale three multi-story office buildings , totaling over 160,000 square feet, in the highly sought-after Town Center in the heart of Virginia Beach. Town Center, an emerging downtown core in the heart of Virginia Beach’s Central Business District, features a vibrant urban mix of upscale retail, Class A office space, luxury residential units, entertainment and cultural facilities. The 25-acre development spans 17 city blocks. The ongoing mixed-use development encompasses more than 800,000 square feet of Class A office space, 700,000 square feet of upscale retail, dining and business-class hotels. The Town Center/Pembroke area features a sophisticated blend of lifestyles, including the best in retail, dining, shopping, entertainment, apartments and office space in the region. Also referred to as Virginia Beach’s Central Business District, Town Center offers premium restaurants and shopping, including Ruth’s Chris Steak House, PF Chang’s, Lululemon, Anthropology and The Fresh Market, as well as multiple hotel options, including the brand new Hyatt Place, The Westin and a Hilton Garden Inn.Major employers located in the Pembroke/Town Center submarket include: The City of Virginia Beach, Howard Hannah Real Estate, GSA, HBA Architects, Troutman Sanders Law Firm, Clark Nexsen and Williams Mullen.Pembroke Office Park offers one of the most convenient locations in the Hampton Roads Market, with direct access to I-264 and I-64.