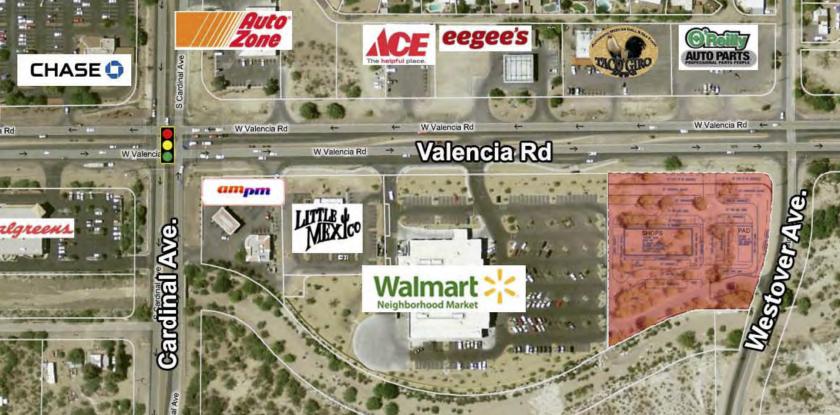
? Anchored by a 39,845 SF Walmart Neighborhood Market.
?? Major retailers at the intersection include Safeway, Family Dollar,
Aaron’s, O’Reilly Auto Parts, Auto Zone, Ace Hardware, Walgreens,
eegee’s, McDonald’s, KFC, Subway, Jack-In-The-Box, Filaberto’s and
many more.
?? Valencia Road is a heavily traveled arterial connecting the far southwest
side of Tucson with I-19, the Tucson International Airport and I-10 on
the southeast side.
?? Casino Del Sol and Casino of the Sun are located to the west on
Valencia Rd. Casino del Sol has added a new hotel, convention center
and golf course.
?? This is the main neighborhood intersection closest to the major housing
areas to the west, which includes some of the southwest Tucson’s
largest master planned communities such as Midvale Park and Star
Valley.
?? Estimated delivery date is August 2021.
No part of this information may be copied, reproduced, repurposed, or screen-captured for any commercial purpose without prior written authorization from MyEListing.
While we strive to provide the most accurate information, all listing information, and demographic data, is provided by third-parties. As such, MyEListing will not be responsible for the accuracy of the information. It is strongly recommended that you verify all information with the listing agent, and any relevant agencies, prior to making any decisions.
What is the asking price for 6600 S Vereda Rosa in Tucson?
The asking price for 6600 S Vereda Rosa is $7.00 a SF per Year
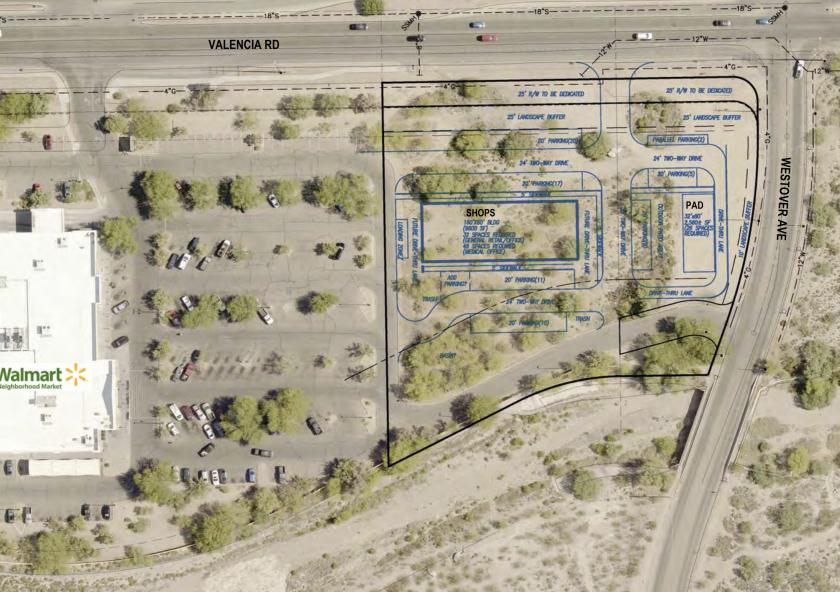
What is the building size of this commercial Retail property?
The size of this multi-unit property varies between 1200 - 9600 square feet
What kind of Retail is the propery at 6600 S Vereda Rosa?
The property at 6600 S Vereda Rosa Tucson, AZ 85746 is listed as a Shopping Center Retail property
What is the population within 1 mile of 6600 S Vereda Rosa in Tucson?
The population within 1 mile of 6600 S Vereda Rosa Tucson, AZ 85746 is 9,005 people.
Who do I contact for questions about 6600 S Vereda Rosa?
You should contact the listing agent,
Craig Finfrock, for any details regarding this commercial listing.