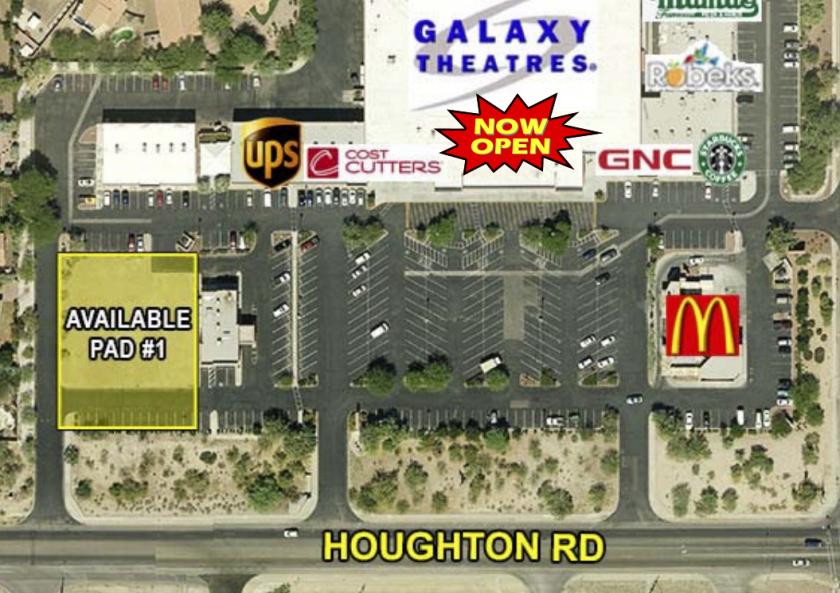
The 55,000 square foot anchor, Galaxy Theatres, is now
open.
? PAD #1 is located within Montesa Plaza and has Houghton
Road frontage.
? Located in the heart of the upper middle class northeast
Tucson sub-market.
? Houghton is being expanded to six lanes from I-10 to the
south and to Tanque Verde Road to the north, making it the
major north/south arterial in the far east section of Tucson.
? Montesa Plaza retailers include: Galaxy Theatres and Hops
Sports Grill coming soon! Starbucks, Mama’s Pizza, Robeks
Juice, GNC, Sally Beauty Supp
No part of this information may be copied, reproduced, repurposed, or screen-captured for any commercial purpose without prior written authorization from MyEListing.
While we strive to provide the most accurate information, all listing information, and demographic data, is provided by third-parties. As such, MyEListing will not be responsible for the accuracy of the information. It is strongly recommended that you verify all information with the listing agent, and any relevant agencies, prior to making any decisions.
What is the asking price for 170 South Houghton Road in Tucson?
The asking price for 170 South Houghton Road is $650,000
How much land does the Tucson, AZ property at 170 South Houghton Road include?
170 South Houghton Road in Tucson includes 0.550 acres of land
What kind of Land is the propery at 170 South Houghton Road?
The property at 170 South Houghton Road Tucson, AZ 85748 is listed as a Retail Pad Site Land property
What is the population within 1 mile of 170 South Houghton Road in Tucson?
The population within 1 mile of 170 South Houghton Road Tucson, AZ 85748 is 9,283 people.
Who do I contact for questions about 170 South Houghton Road?
You should contact the listing agent,
Craig Finfrock, for any details regarding this commercial listing.