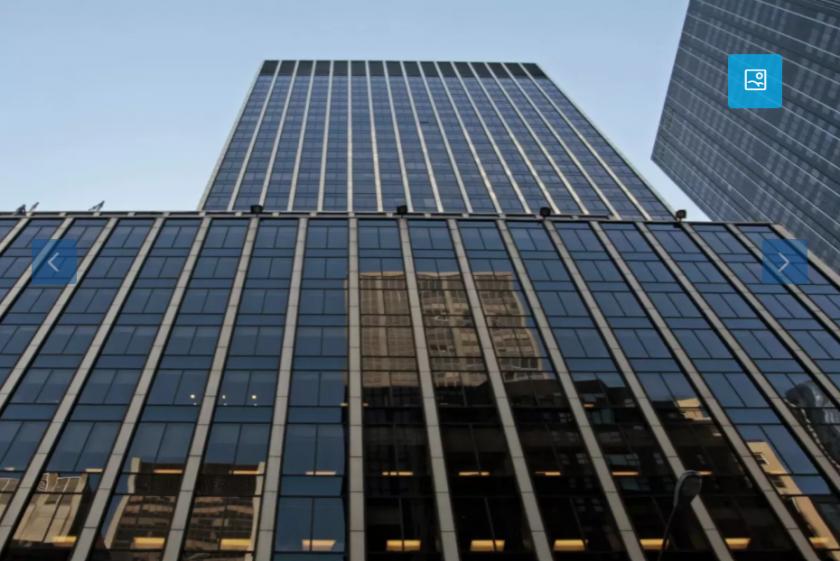
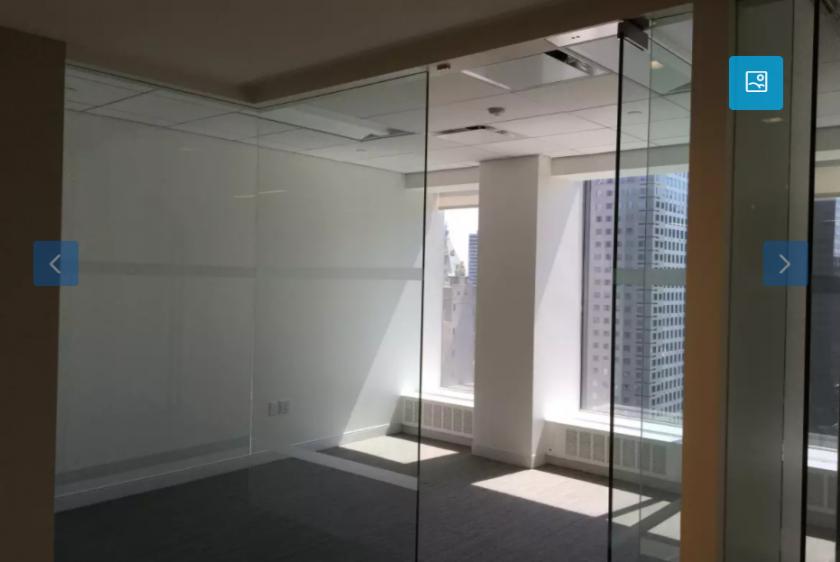
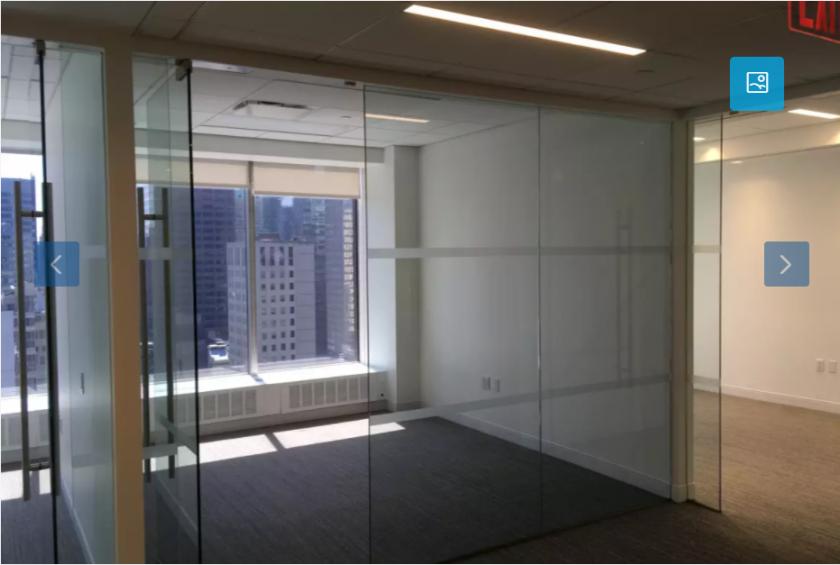
High floors 1,600-3,000 rentable sq. ft. Class A office space for lease. Brand new space with glass partition walls and two large, front windows. Excellent lighting. 4 offices, 4 workstations, 1 conference room, 1 receptionist and pantry. New corridors and new restrooms available on the floor of the office space. 24/7 attended lobby.Building NotesLocated within the heart of the Plaza district at the southeast nook of fifty fifth Street, 1350 Ave of the Americas is a beautiful 590,000-rectangular-foot boutique office constructing. The these days renovated foyer capabilities French walnut timber panels, Paloma limestone, white steel paneling, and Pietra Bedonia flooring. The property is domestic to a various tenant base that consists of financial, accounting, regulation, and generation corporations. The award-winning 1350 Avenue of the Americas is a coveted and prestigious deal with.Completed in 1965, 1350 Ave of the Americas become designed by using Emery Roth & Sons and typifies the postwar wave of improvement that modified the Avenue of Americas core immediately west of Rockefeller Center. Featuring a black glass façade divided through vertical white marble piers, the constructing’s setbacks step far from the street to provide a greater experience of transparency and light.Transportation around 1350 Ave of the Americas, Plaza DistrictBeing within walking distance to iconic landmarks, shopping centres, dining, and entertainment options, Plaza District gives an array of accessible choices for transportation options. A variety of subway and bus stations served this hot-spot location and giving you an easy way to moving from one point to another. The M1, M2, M5, M7, and M57, and the highly-trafficked 5th Avenue Station is located right at the beginning of Central Park on 59th Street.Subway: Lexington Avenue/59th Street "4" train?"5" train?"6" train"6" express train?"N" train?"R" train?"W" train59th Street–Columbus Circle "1" train?"A" train?"B" train?"C" train?"D" train