Available space 4,200 SF
• Fully furnished office in Union Square
• Perfectly setup for TAMI tenants
• Conveniently located to multiple subway lines
• Hardwood floors and exposed ceilings throughout
• One block from Union Square Park
Amenities
Bus Line
Food Service
Metro/Subway
Restaurant
Security System
Building Notes
.
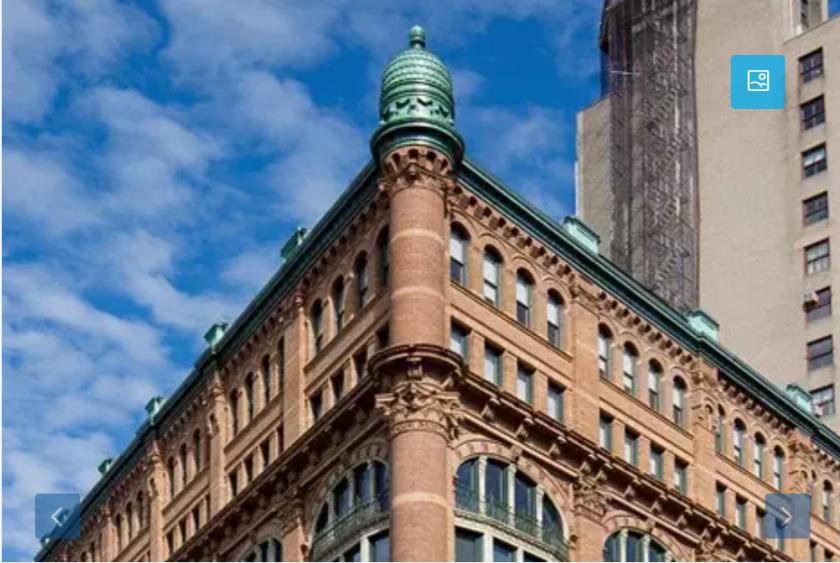
841 Broadway, located on the corner of 13th Street, gets its name from Cornelius Roosevelt, Theodore’s grandfather, who lived on the block during the Civil War era. This Romanesque Revival building is just one block from the newly revitalized Union Square Park. The Park features landscaped greenery, as well as picnic tables and benches for enjoying a midday break. Union Square is a subway hub center featuring train lines to all parts of Manhattan as well as the outer boroughs.
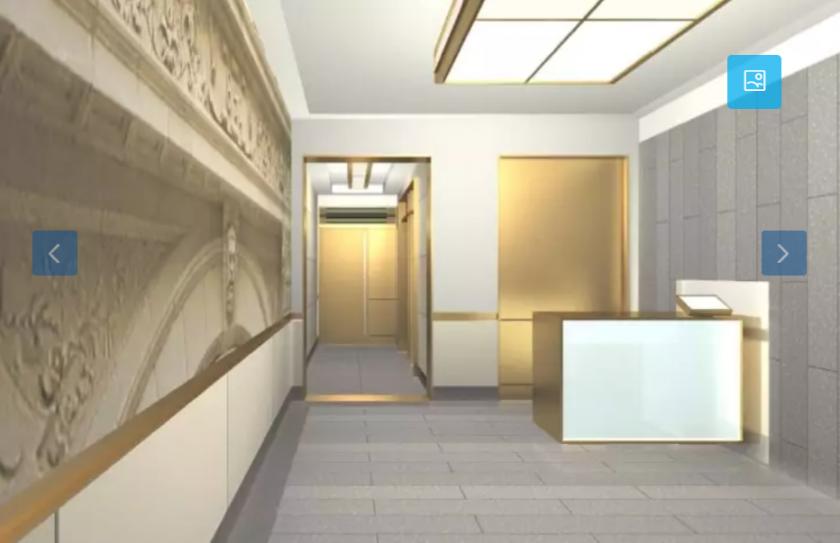
* New lobby renovation coming soon
* New windows and new bathrooms
* Separate freight entrance on 13th Street
* Attended lobby
* 52 windows on every floor
* Ample electrical power
* CCTV surveillance and recording equipment
841 Broadway, E 13th St NY NY
.
Transportation in Union Square
Thousands of people are coming each day in Union Square – tourists, students, and business professionals. Because of the perfect central location (in the center of Midtown South), it is a popular place to work in. The public transportation is very convenient to serve all these people – subway, bus or train. At 14th St. Union Square train station, NYC’s one of the biggest transportation center hub, is in Union Square. It is served by the 4, 5, 6, L, N, R, and Q trains. These buses service Union Square: the M1, M2, M3, M7, M9, M14. Commuters can use the PATH train on Sixth Ave.
Broadway Line yellow "N" train?"Q" train?"R" train?"W" train
Lexington Avenue Line green "4" train?"5" train?"6" train"6" express train
Union Square office space