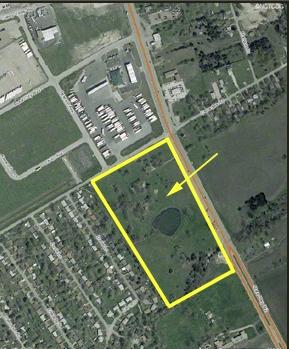
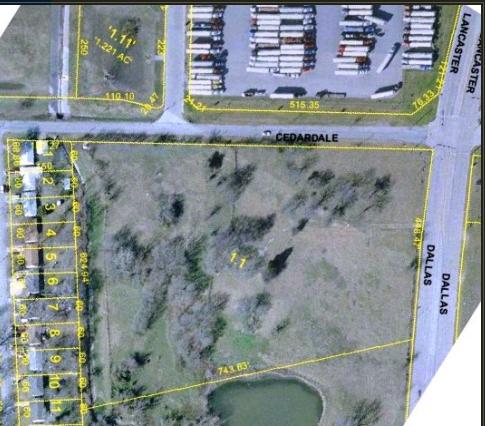
1-Mile | 3-Miles | 5-Miles | ||
---|---|---|---|---|
Total Population | 4,659 | 53,816 | 152,893 | |
Population Median Age | 33 | 35 | 36 | |
Population by Age | 0-9 Yrs | 623 (13%) | 7917 (14%) | 22236 (14%) |
10-19 Yrs | 957 (20%) | 9288 (17%) | 24675 (16%) | |
20-29 Yrs | 547 (11%) | 7686 (14%) | 20311 (13%) | |
30-39 Yrs | 620 (13%) | 6950 (12%) | 19213 (12%) | |
40-49 Yrs | 938 (20%) | 6992 (12%) | 18863 (12%) | |
50-59 Yrs | 463 (9%) | 6613 (12%) | 19026 (12%) | |
60-69 Yrs | 253 (5%) | 4511 (8%) | 14445 (9%) | |
70+ Yrs | 259 (5%) | 3860 (7%) | 14124 (9%) | |
Median HH Income | $60,307 | $42,501 | $39,208 | |
Total Household Income | < 24K | 272 (19%) | 5669 (30%) | 17799 (33%) |
25-49K | 289 (20%) | 4972 (27%) | 14883 (27%) | |
50-74K | 250 (17%) | 2987 (16%) | 8727 (16%) | |
75-99K | 203 (14%) | 2094 (11%) | 5453 (10%) | |
100-199K | 384 (27%) | 2485 (13%) | 6123 (11%) | |
200K+ | 22 (1%) | 200 (1%) | 707 (1%) | |
Highest Education Level | No Diploma | 492 | 5967 | 19425 |
Diploma or GED | 743 | 11118 | 31765 | |
Some College | 903 | 9187 | 24881 | |
Assoc. Degree | 176 | 1922 | 5607 | |
Bachelors Degree | 271 | 3066 | 9493 | |
Higher Degree | 254 | 1598 | 4984 | |
Total Housing Units | 1,464 | 19,862 | 58,119 | |
--Owner-Occupied | 1,046 | 9,720 | 28,074 | |
--Renter-Occupied | 375 | 8,688 | 25,619 | |
Owner-Occupied Values | < 100K | 295 | 4250 | 13062 |
100-199K | 516 | 4541 | 11951 | |
200-299K | 186 | 697 | 2273 | |
300-399K | 17 | 73 | 294 | |
400-499K | 0 | 4 | 85 | |
500K+ | 32 | 156 | 409 | |
Total Working Age Population | 3,450 | 39,970 | 114,527 | |
In Work Force | 2,414 | 24,496 | 65,539 | |
Not In Work Force | 1,035 | 15,474 | 48,988 | |
Workforce Employed | 2,334 | 23,047 | 61,392 | |
Workforce Unemployed | 80 | 1,449 | 4,126 | |
Civlian Workforce | 2,414 | 24,496 | 65,518 | |
Military Workforce | 0 | 1 | 21 | |
Total Households | 1,421 | 18,408 | 53,692 | |
Family Households | 1,043 | 12,683 | 34,674 | |
Non-Family Households | 378 | 5,724 | 19,018 | |
Married Couple | 558 | 6,088 | 16,674 | |
Other Family | 485 | 6,595 | 18,000 | |
Married w/Child | 264 | 2,512 | 6,344 | |
Single Male w/Child | 140 | 799 | 1,792 | |
Single Female w/Child | 179 | 3,116 | 7,698 |
Population Change Last Two Decades - Plus Projection
2000 | % | 2010 | % | 2020 | % | 2030 | |
---|---|---|---|---|---|---|---|
Texas | 20,851,820 | +21 | 25,145,561 | +18 | 29,677,668 | +18 | 34,894,452 |
Dallas County | 2,218,899 | +7 | 2,368,139 | +15 | 2,734,111 | +14 | 3,106,298 |
Total Working Age Population:
Total Households:
Total Working Age Population:
Total Households:
Total Working Age Population:
Total Households: