Approximately 150,000 vehicles per day (I-20)
Area New Home Construction up 26% over the past 5 years
City of Lancaster and EDC support/subsidies
Prologis building 3.5M Sf of Industrial Distribution.
UNT Dallas Campus half mile north of IH 20 along Houston School RD.
Allen Group buys 6,000 acres 3 miles to the east along IH 45 & IH 20
Mixed Use Development. Commercial, Retail, Restaurant, Hotel and Pad Sites Available. Residential, Office and Warehouse/Flex Development opportunities. This area has seen an in-flux of activity recently with Prologis building 3.5M SF of industrial distribution adjacent to site.
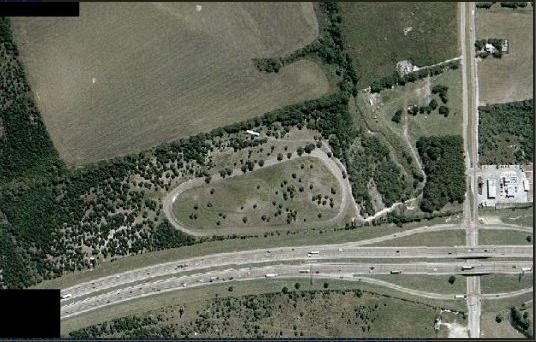
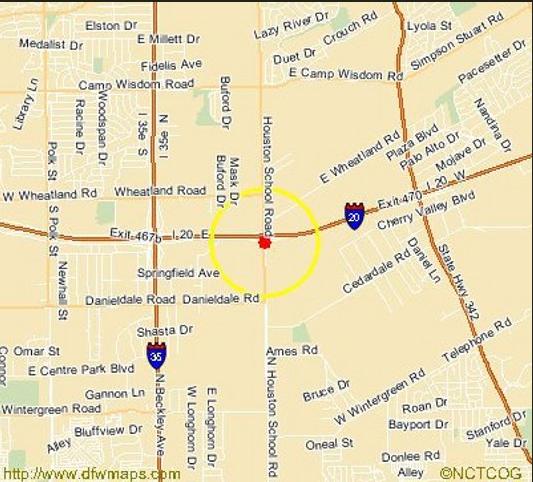
Located at the SEQ of I-20 and Houston School Road. This area has excellent visibility and access to and from I-20 and is minutes away from I-35E, I-45, I-30, and Downtown Dallas. Service roads are currently under construction on the north and south sides of IH 20.
Land Building Area: 70 Acres with over 400,000 SF of in-line retail space planned, and Pad Sites for Ground Lease, Build-to Suit, or Sale. An Anchor box of over 175K SF-250K SF available. Hotel Sites available.
Other Features: Excellent visibility and access with over 125,000 vehicles passing this location daily. Over 5,421’ of frontage along I-20; 900’ of frontage along Houston School Road; and new ingress/egress under construction for I-20 service roads. All Utilities available.
No part of this information may be copied, reproduced, repurposed, or screen-captured for any commercial purpose without prior written authorization from MyEListing.
While we strive to provide the most accurate information, all listing information, and demographic data, is provided by third-parties. As such, MyEListing will not be responsible for the accuracy of the information. It is strongly recommended that you verify all information with the listing agent, and any relevant agencies, prior to making any decisions.
What is the asking price for 4284 North Houston School Road in Lancaster?
The asking price for 4284 North Houston School Road is $20,000,000
How much land does the Lancaster, TX property at 4284 North Houston School Road include?
4284 North Houston School Road in Lancaster includes 70.000 acres of land
What kind of Land is the propery at 4284 North Houston School Road?
The property at 4284 North Houston School Road Lancaster, TX 75134 is listed as a Mixed Use Land Land property
What is the population within 1 mile of 4284 North Houston School Road in Lancaster?
The population within 1 mile of 4284 North Houston School Road Lancaster, TX 75134 is 3,134 people.
Who do I contact for questions about 4284 North Houston School Road?
You should contact the listing agent,
Tom Metcalfe, for any details regarding this commercial listing.