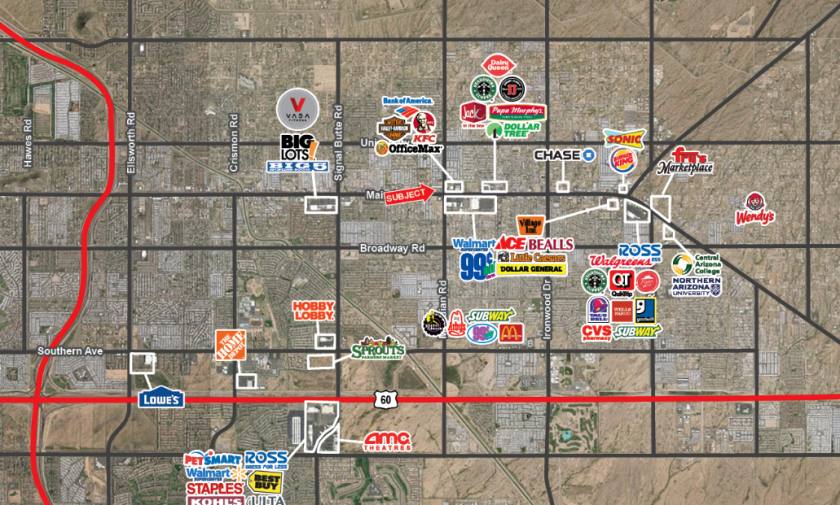
1-Mile | 3-Miles | 5-Miles | ||
---|---|---|---|---|
Total Population | 10,609 | 80,453 | 171,387 | |
Population Median Age | 45 | 44 | 44 | |
Population by Age | 0-9 Yrs | 849 (8%) | 8008 (9%) | 17785 (10%) |
10-19 Yrs | 1397 (13%) | 9757 (12%) | 20032 (11%) | |
20-29 Yrs | 1024 (9%) | 8210 (10%) | 17576 (10%) | |
30-39 Yrs | 1087 (10%) | 8982 (11%) | 18631 (10%) | |
40-49 Yrs | 1333 (12%) | 9445 (11%) | 20109 (11%) | |
50-59 Yrs | 1401 (13%) | 10473 (13%) | 21040 (12%) | |
60-69 Yrs | 1841 (17%) | 11470 (14%) | 23768 (13%) | |
70+ Yrs | 1677 (15%) | 14109 (17%) | 32448 (18%) | |
Median HH Income | $54,164 | $51,389 | $56,428 | |
Total Household Income | < 24K | 973 (22%) | 7235 (22%) | 12839 (18%) |
25-49K | 1042 (24%) | 8563 (26%) | 17001 (25%) | |
50-74K | 850 (19%) | 7141 (21%) | 14502 (21%) | |
75-99K | 628 (14%) | 3900 (12%) | 8707 (12%) | |
100-199K | 703 (16%) | 4740 (14%) | 12332 (18%) | |
200K+ | 132 (3%) | 908 (2%) | 2485 (3%) | |
Highest Education Level | No Diploma | 780 | 7326 | 12798 |
Diploma or GED | 2555 | 18330 | 35781 | |
Some College | 2238 | 16020 | 36045 | |
Assoc. Degree | 934 | 5833 | 11609 | |
Bachelors Degree | 957 | 8365 | 20710 | |
Higher Degree | 435 | 3209 | 8947 | |
Total Housing Units | 5,794 | 41,627 | 86,594 | |
--Owner-Occupied | 3,290 | 24,937 | 51,637 | |
--Renter-Occupied | 1,038 | 7,549 | 16,229 | |
Owner-Occupied Values | < 100K | 1376 | 10161 | 17095 |
100-199K | 863 | 6995 | 13249 | |
200-299K | 748 | 4804 | 11846 | |
300-399K | 188 | 1811 | 5631 | |
400-499K | 83 | 658 | 2009 | |
500K+ | 32 | 509 | 1807 | |
Total Working Age Population | 8,938 | 66,472 | 141,395 | |
In Work Force | 4,722 | 35,529 | 74,950 | |
Not In Work Force | 4,217 | 30,943 | 66,445 | |
Workforce Employed | 4,517 | 33,550 | 70,831 | |
Workforce Unemployed | 205 | 1,917 | 3,969 | |
Civlian Workforce | 4,722 | 35,467 | 74,800 | |
Military Workforce | 0 | 62 | 150 | |
Total Households | 4,328 | 32,486 | 67,866 | |
Family Households | 2,629 | 20,182 | 43,962 | |
Non-Family Households | 1,699 | 12,303 | 23,904 | |
Married Couple | 2,111 | 15,569 | 34,762 | |
Other Family | 518 | 4,613 | 9,200 | |
Married w/Child | 558 | 4,690 | 10,586 | |
Single Male w/Child | 150 | 728 | 1,314 | |
Single Female w/Child | 126 | 1,325 | 2,801 |
Population Change Last Two Decades - Plus Projection
2000 | % | 2010 | % | 2020 | % | 2030 | |
---|---|---|---|---|---|---|---|
Arizona | 5,130,632 | +25 | 6,392,017 | +14 | 7,286,100 | +14 | 8,284,900 |
Gila County | 51,335 | +4 | 53,597 | +3 | 55,100 | +1 | 55,400 |
Maricopa County | 3,072,149 | +24 | 3,817,117 | +16 | 4,436,900 | +15 | 5,107,700 |
Pinal County | 179,727 | +109 | 375,770 | +24 | 466,200 | +32 | 616,200 |
Total Working Age Population:
Total Households:
Total Working Age Population:
Total Households:
Total Working Age Population:
Total Households: