Retail Space
21001 North Tatum Boulevard Phoenix, AZ 85054
21001 North Tatum Boulevard Phoenix, AZ 85054
Details & Description
Property Highlights
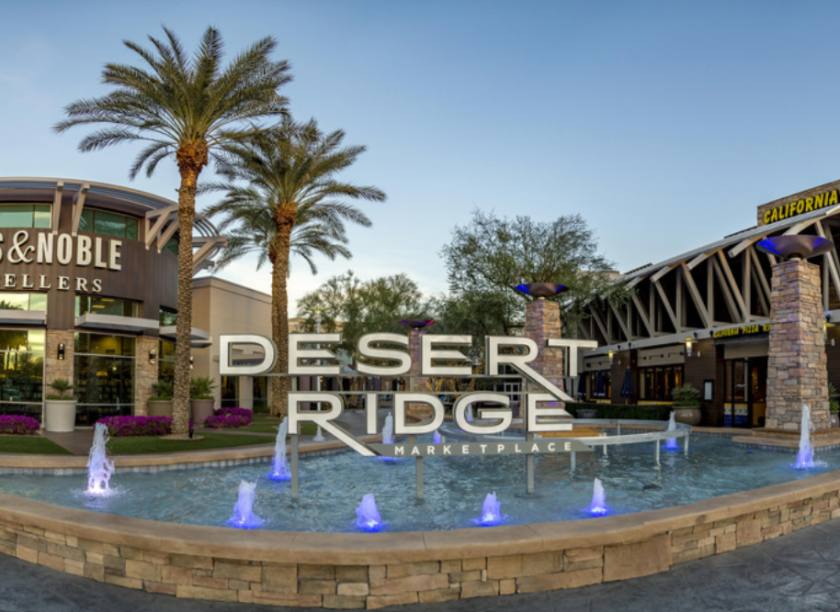
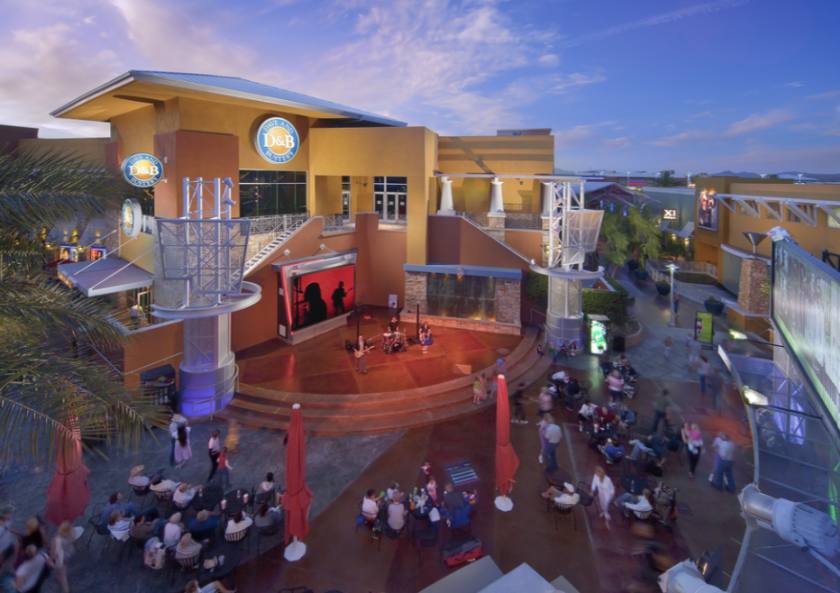
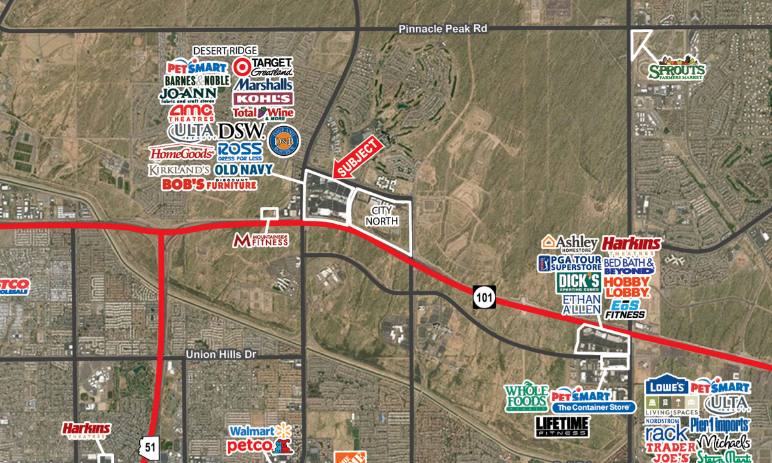
• Key Tenants: Target, Kohl's, AMC Theaters, Dave & Buster's, H&M, VS Pink, Barnes & Noble, Ross, O
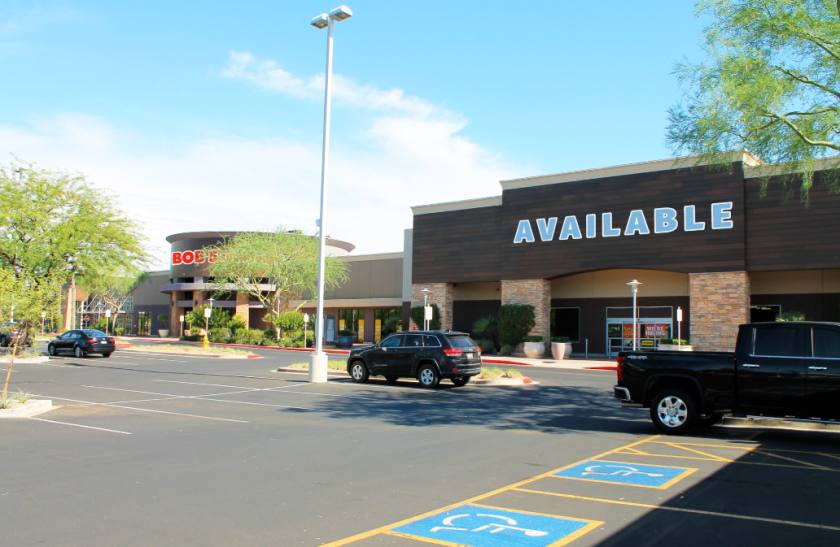
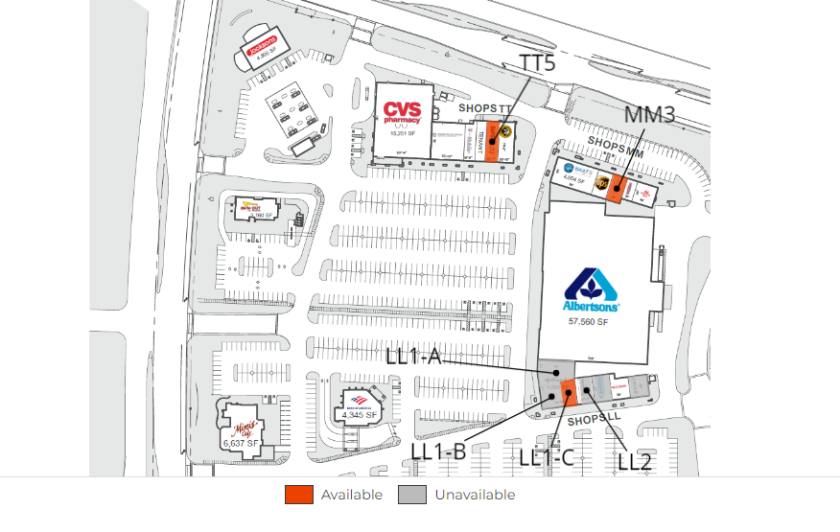
• Regional power & entertainment center with 1.2M GLA & over 26M customers in 2015 space available
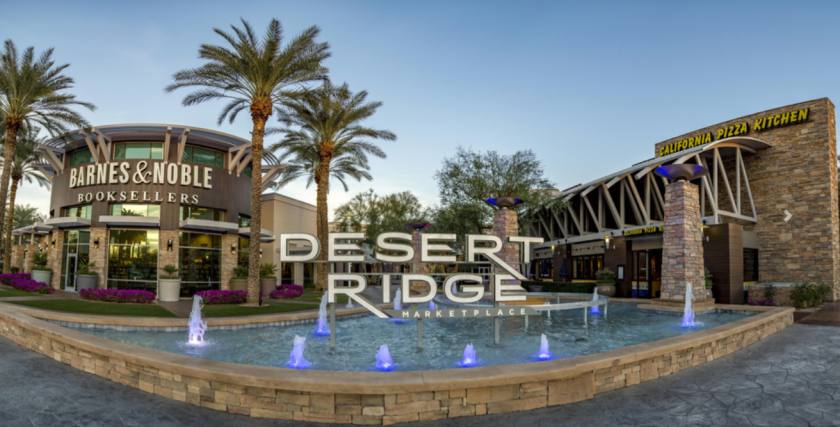
Additional Photos
Listing Agents

Jared Cauffield
O: 602-595-3254
jcauffield@w-retail.com
O: 602-595-3254
jcauffield@w-retail.com

Ryan Desmond
Western Retail Advisors
O: 602-778-3747
M: 602-931-4489
ddesmond@w-retail.com
Western Retail Advisors
O: 602-778-3747
M: 602-931-4489
ddesmond@w-retail.com

Charles Skaggs
O: 602-368-1737
cskaggs@w-retail.com
O: 602-368-1737
cskaggs@w-retail.com
While we strive to provide the most accurate information, all listing information, and demographic data, is provided by third-parties. As such, MyEListing will not be responsible for the accuracy of the information. It is strongly recommended that you verify all information with the listing agent, and any relevant agencies, prior to making any decisions.