Commercial Land
11624 West Bell Road Surprise, AZ 85378
11624 West Bell Road Surprise, AZ 85378
Details & Description
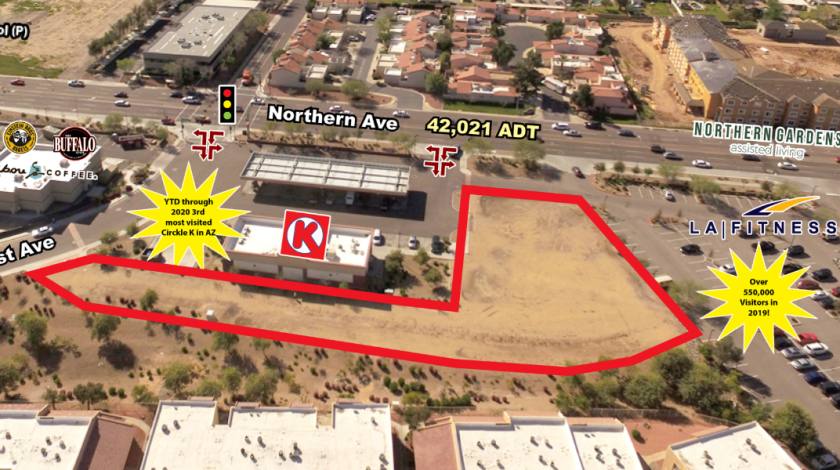
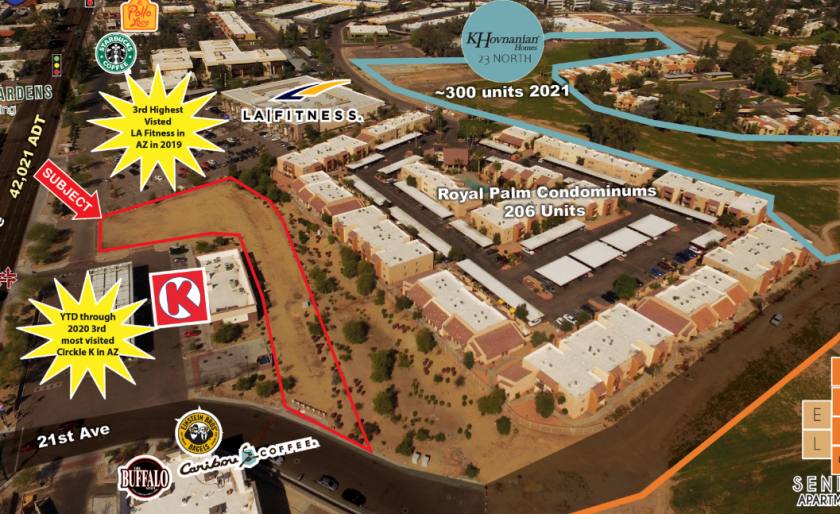
Property Highlights
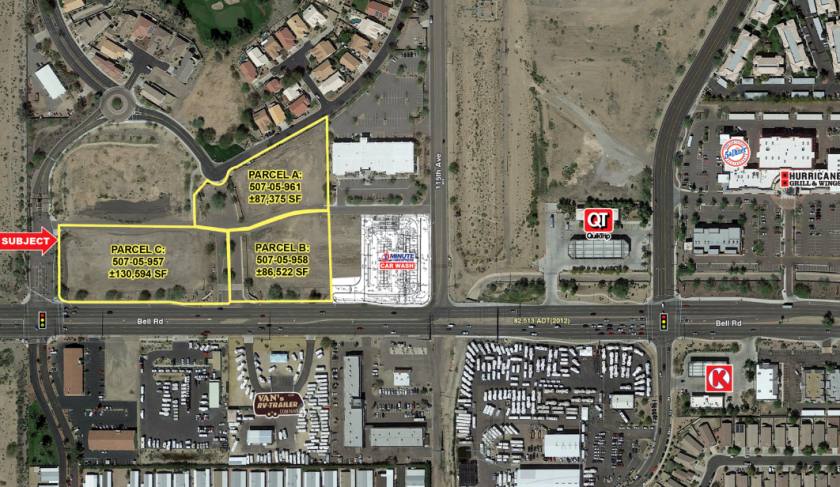
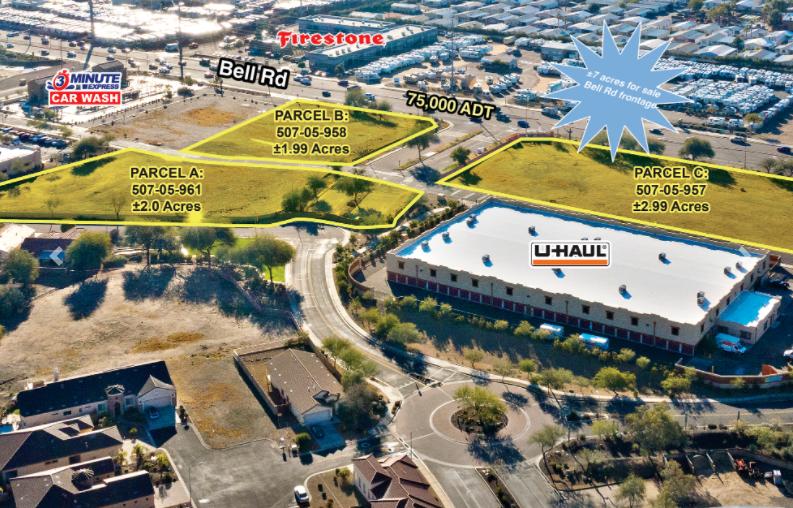
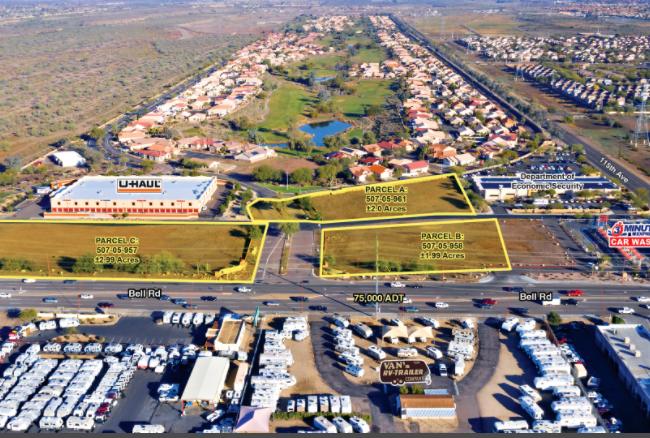
- • Approx. 850 Ft Frontage on Bell Rd
- • Zoning: PAD General Commercial
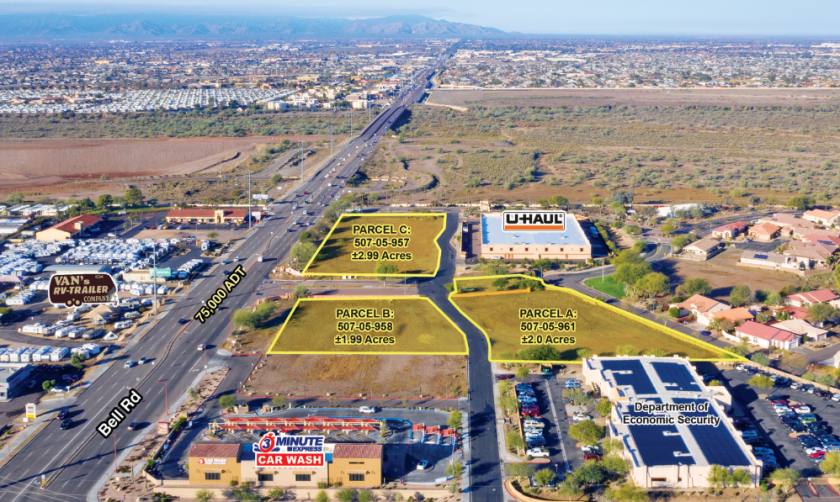
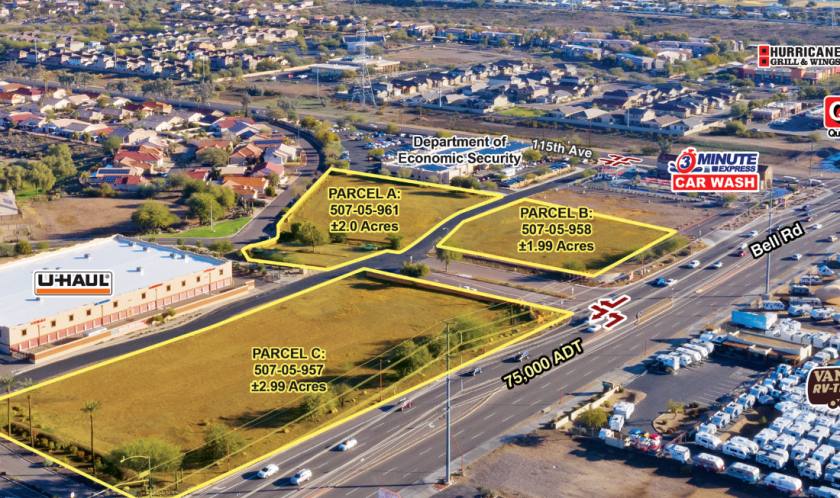
- • Parcel A: ±87,375 SF
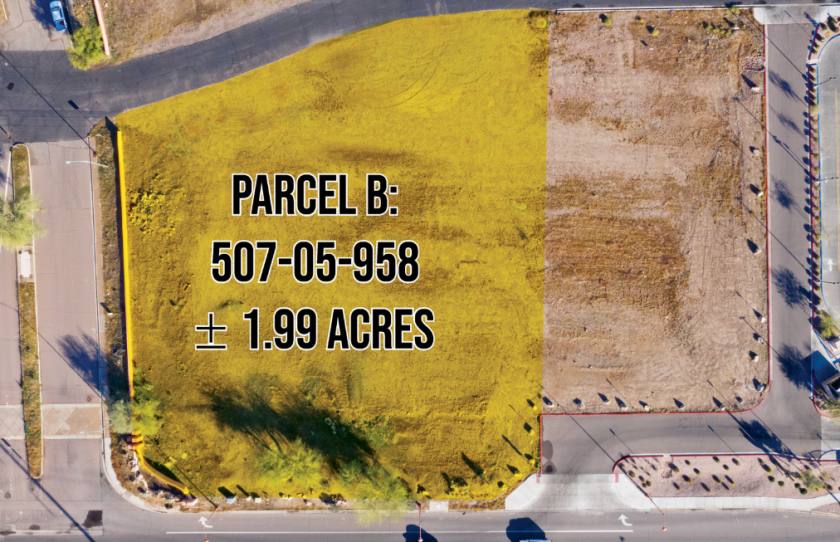
- • Parcel B: ±80,746 SF
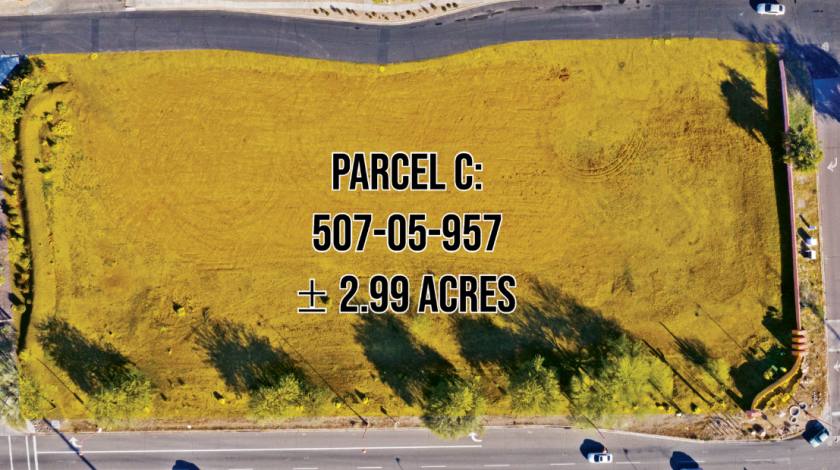
- • Parcel C: ±130,594 SF
Additional Photos
Listing Agents

Brian Gausden
O: 602-778-3740
bgausden@w-retail.com
O: 602-778-3740
bgausden@w-retail.com
While we strive to provide the most accurate information, all listing information, and demographic data, is provided by third-parties. As such, MyEListing will not be responsible for the accuracy of the information. It is strongly recommended that you verify all information with the listing agent, and any relevant agencies, prior to making any decisions.