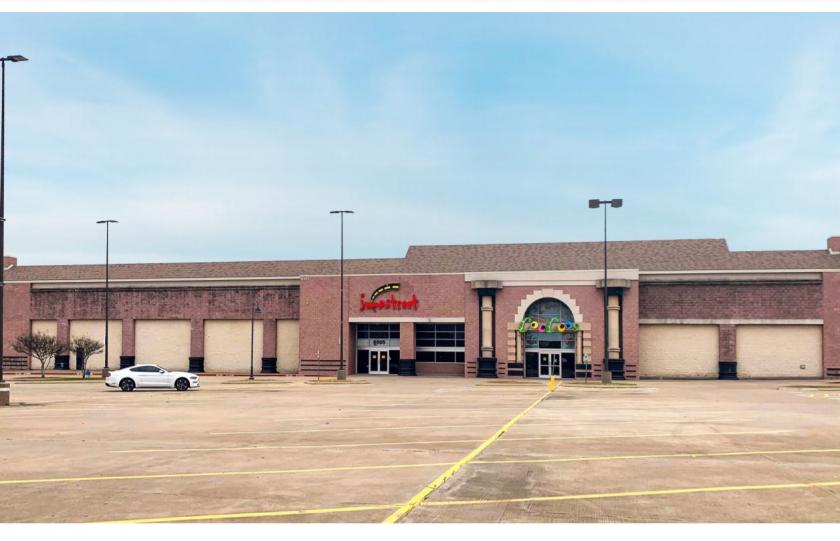
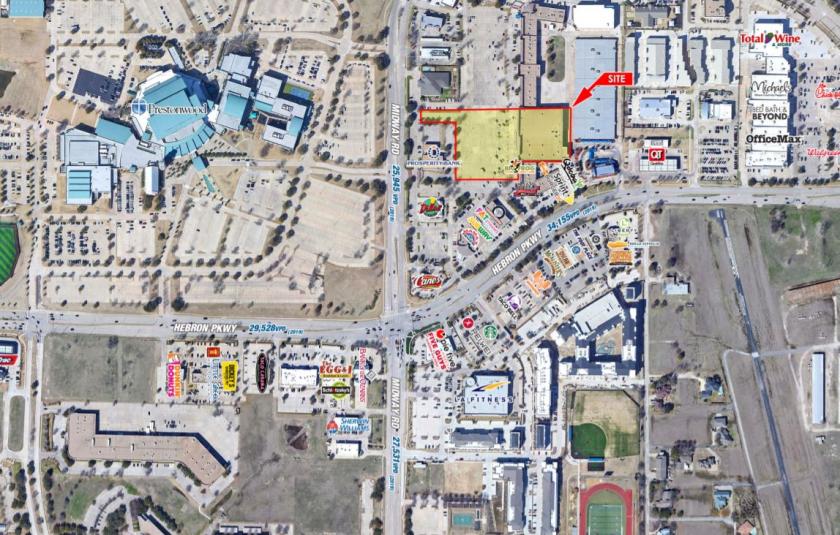
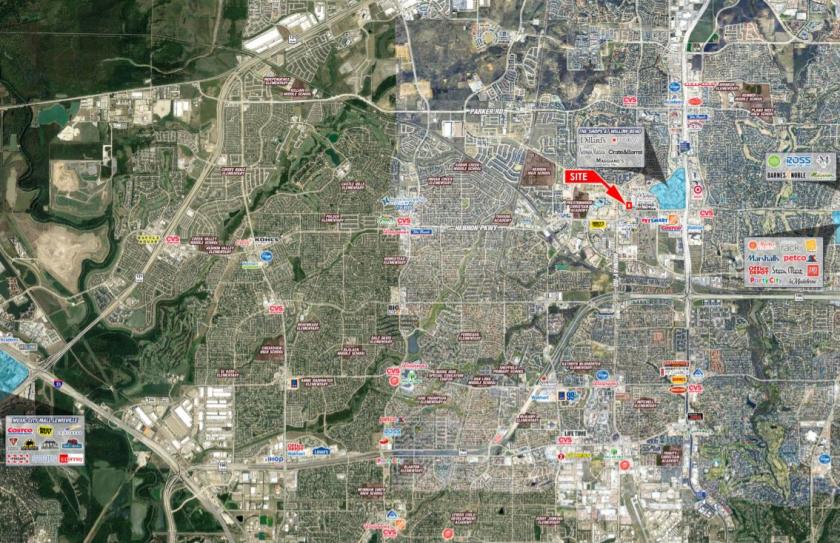
1-Mile | 3-Miles | 5-Miles | ||
---|---|---|---|---|
Total Population | 8,059 | 127,104 | 328,718 | |
Population Median Age | 39 | 38 | 38 | |
Population by Age | 0-9 Yrs | 815 (10%) | 13287 (10%) | 35850 (10%) |
10-19 Yrs | 959 (11%) | 12800 (10%) | 34789 (10%) | |
20-29 Yrs | 1308 (16%) | 21763 (17%) | 52465 (15%) | |
30-39 Yrs | 1115 (13%) | 22684 (17%) | 55795 (16%) | |
40-49 Yrs | 898 (11%) | 18580 (14%) | 46700 (14%) | |
50-59 Yrs | 1264 (15%) | 16595 (13%) | 43917 (13%) | |
60-69 Yrs | 960 (11%) | 13287 (10%) | 34658 (10%) | |
70+ Yrs | 741 (9%) | 8107 (6%) | 24545 (7%) | |
Median HH Income | $81,614 | $70,623 | $79,673 | |
Total Household Income | < 24K | 339 (9%) | 6348 (10%) | 15433 (10%) |
25-49K | 685 (19%) | 13344 (23%) | 26823 (19%) | |
50-74K | 593 (17%) | 10861 (18%) | 24529 (17%) | |
75-99K | 389 (11%) | 6836 (11%) | 19166 (13%) | |
100-199K | 742 (21%) | 12219 (21%) | 35960 (25%) | |
200K+ | 693 (20%) | 8103 (14%) | 18826 (13%) | |
Highest Education Level | No Diploma | 280 | 4158 | 12763 |
Diploma or GED | 619 | 12995 | 34612 | |
Some College | 1025 | 18425 | 44144 | |
Assoc. Degree | 258 | 6112 | 15801 | |
Bachelors Degree | 2396 | 33558 | 84032 | |
Higher Degree | 1221 | 17497 | 45922 | |
Total Housing Units | 3,725 | 63,427 | 152,774 | |
--Owner-Occupied | 1,437 | 23,149 | 65,567 | |
--Renter-Occupied | 2,005 | 34,562 | 75,171 | |
Owner-Occupied Values | < 100K | 5 | 322 | 1528 |
100-199K | 2 | 3716 | 11228 | |
200-299K | 61 | 4856 | 17284 | |
300-399K | 269 | 3409 | 12726 | |
400-499K | 368 | 3157 | 9193 | |
500K+ | 732 | 7689 | 13606 | |
Total Working Age Population | 6,615 | 105,993 | 271,711 | |
In Work Force | 4,721 | 81,235 | 202,068 | |
Not In Work Force | 1,894 | 24,758 | 69,643 | |
Workforce Employed | 4,624 | 78,457 | 194,204 | |
Workforce Unemployed | 97 | 2,700 | 7,660 | |
Civlian Workforce | 4,721 | 81,157 | 201,864 | |
Military Workforce | 0 | 78 | 204 | |
Total Households | 3,441 | 57,711 | 140,738 | |
Family Households | 2,054 | 30,793 | 81,582 | |
Non-Family Households | 1,387 | 26,918 | 59,155 | |
Married Couple | 1,731 | 23,361 | 64,003 | |
Other Family | 323 | 7,432 | 17,579 | |
Married w/Child | 737 | 9,788 | 27,800 | |
Single Male w/Child | 54 | 916 | 1,961 | |
Single Female w/Child | 162 | 3,574 | 7,667 |
Population Change Last Two Decades - Plus Projection
2000 | % | 2010 | % | 2020 | % | 2030 | |
---|---|---|---|---|---|---|---|
Texas | 20,851,820 | +21 | 25,145,561 | +18 | 29,677,668 | +18 | 34,894,452 |
Collin County | 491,675 | +59 | 782,341 | +33 | 1,039,369 | +34 | 1,391,461 |
Dallas County | 2,218,899 | +7 | 2,368,139 | +15 | 2,734,111 | +14 | 3,106,298 |
Denton County | 432,976 | +53 | 662,614 | +36 | 897,953 | +37 | 1,234,110 |
Total Working Age Population:
Total Households:
Total Working Age Population:
Total Households:
Total Working Age Population:
Total Households: