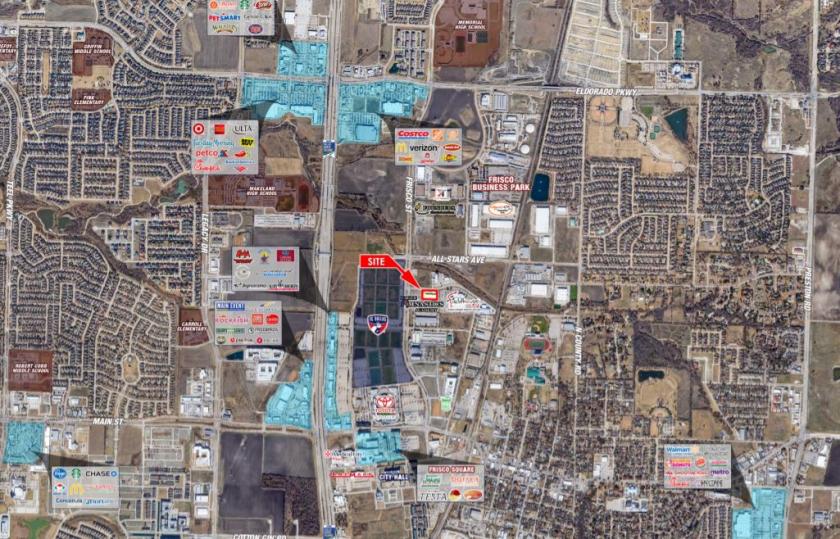
1-Mile | 3-Miles | 5-Miles | ||
---|---|---|---|---|
Total Population | 4,232 | 76,732 | 214,152 | |
Population Median Age | 34 | 34 | 34 | |
Population by Age | 0-9 Yrs | 567 (13%) | 10730 (13%) | 32815 (15%) |
10-19 Yrs | 595 (14%) | 14632 (19%) | 37216 (17%) | |
20-29 Yrs | 774 (18%) | 7537 (9%) | 19985 (9%) | |
30-39 Yrs | 604 (14%) | 9985 (13%) | 32704 (15%) | |
40-49 Yrs | 607 (14%) | 15387 (20%) | 42741 (19%) | |
50-59 Yrs | 618 (14%) | 9799 (12%) | 24550 (11%) | |
60-69 Yrs | 201 (4%) | 4874 (6%) | 13766 (6%) | |
70+ Yrs | 266 (6%) | 3787 (4%) | 10376 (4%) | |
Median HH Income | $86,456 | $119,183 | $118,903 | |
Total Household Income | < 24K | 283 (17%) | 1843 (7%) | 4480 (6%) |
25-49K | 217 (13%) | 3202 (12%) | 7808 (10%) | |
50-74K | 229 (13%) | 2958 (11%) | 8587 (11%) | |
75-99K | 218 (13%) | 2533 (9%) | 8535 (11%) | |
100-199K | 491 (29%) | 9331 (36%) | 27970 (38%) | |
200K+ | 219 (13%) | 5677 (22%) | 14511 (20%) | |
Highest Education Level | No Diploma | 205 | 2296 | 5986 |
Diploma or GED | 375 | 5058 | 15476 | |
Some College | 570 | 8638 | 24351 | |
Assoc. Degree | 204 | 3391 | 8954 | |
Bachelors Degree | 917 | 17759 | 49265 | |
Higher Degree | 389 | 9907 | 30622 | |
Total Housing Units | 1,842 | 27,629 | 76,451 | |
--Owner-Occupied | 711 | 17,666 | 51,883 | |
--Renter-Occupied | 945 | 7,877 | 20,008 | |
Owner-Occupied Values | < 100K | 17 | 285 | 1142 |
100-199K | 103 | 1177 | 4161 | |
200-299K | 184 | 3761 | 12971 | |
300-399K | 162 | 4563 | 13797 | |
400-499K | 130 | 3308 | 9486 | |
500K+ | 115 | 4572 | 10324 | |
Total Working Age Population | 3,292 | 56,315 | 155,756 | |
In Work Force | 2,498 | 40,557 | 114,470 | |
Not In Work Force | 794 | 15,758 | 41,286 | |
Workforce Employed | 2,462 | 39,166 | 109,857 | |
Workforce Unemployed | 36 | 1,276 | 4,380 | |
Civlian Workforce | 2,498 | 40,442 | 114,236 | |
Military Workforce | 0 | 115 | 234 | |
Total Households | 1,656 | 25,543 | 71,891 | |
Family Households | 987 | 19,725 | 55,764 | |
Non-Family Households | 669 | 5,818 | 16,126 | |
Married Couple | 792 | 16,562 | 47,234 | |
Other Family | 195 | 3,163 | 8,531 | |
Married w/Child | 416 | 10,371 | 29,522 | |
Single Male w/Child | 49 | 597 | 1,551 | |
Single Female w/Child | 86 | 1,524 | 3,986 |
Population Change Last Two Decades - Plus Projection
2000 | % | 2010 | % | 2020 | % | 2030 | |
---|---|---|---|---|---|---|---|
Texas | 20,851,820 | +21 | 25,145,561 | +18 | 29,677,668 | +18 | 34,894,452 |
Collin County | 491,675 | +59 | 782,341 | +33 | 1,039,369 | +34 | 1,391,461 |
Denton County | 432,976 | +53 | 662,614 | +36 | 897,953 | +37 | 1,234,110 |
Total Working Age Population:
Total Households:
Total Working Age Population:
Total Households:
Total Working Age Population:
Total Households: