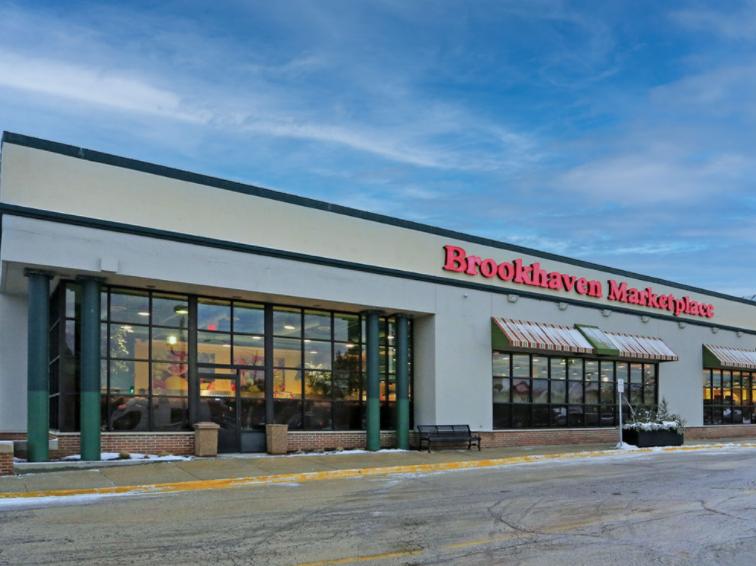
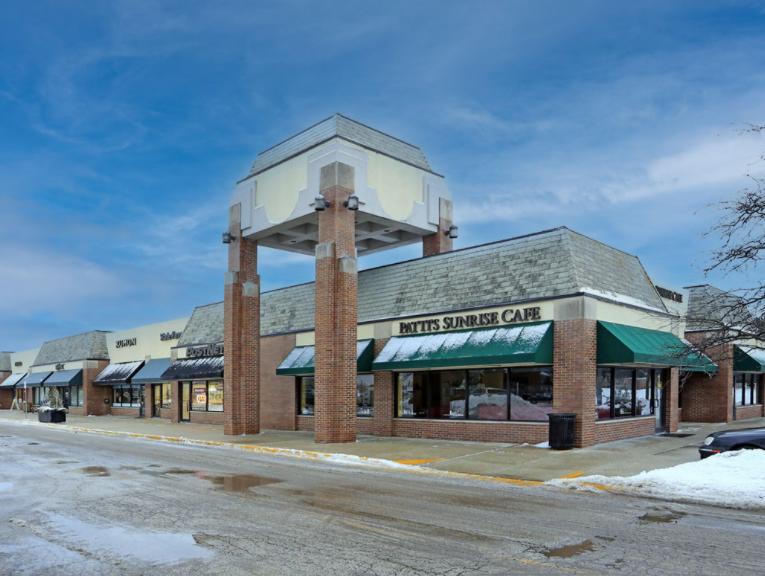
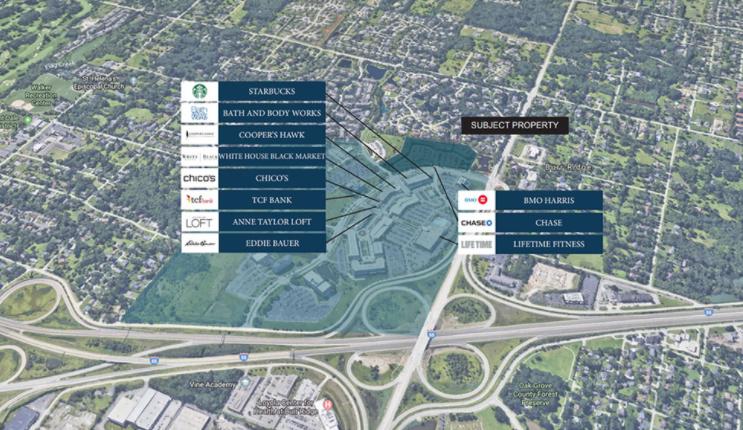
1-Mile | 3-Miles | 5-Miles | ||
---|---|---|---|---|
Total Population | 4,093 | 55,646 | 185,406 | |
Population Median Age | 47 | 44 | 41 | |
Population by Age | 0-9 Yrs | 373 (9%) | 5595 (10%) | 22790 (12%) |
10-19 Yrs | 429 (10%) | 6400 (11%) | 24905 (13%) | |
20-29 Yrs | 150 (3%) | 4469 (8%) | 17238 (9%) | |
30-39 Yrs | 531 (12%) | 6112 (10%) | 21764 (11%) | |
40-49 Yrs | 480 (11%) | 7193 (12%) | 24455 (13%) | |
50-59 Yrs | 611 (14%) | 8283 (14%) | 27907 (15%) | |
60-69 Yrs | 777 (18%) | 8657 (15%) | 24323 (13%) | |
70+ Yrs | 741 (18%) | 8938 (16%) | 22024 (11%) | |
Median HH Income | $132,366 | $95,002 | $92,464 | |
Total Household Income | < 24K | 135 (7%) | 2754 (12%) | 8922 (12%) |
25-49K | 193 (11%) | 3647 (15%) | 11425 (16%) | |
50-74K | 151 (8%) | 3122 (13%) | 9445 (13%) | |
75-99K | 133 (7%) | 2359 (10%) | 7875 (11%) | |
100-199K | 486 (28%) | 6365 (27%) | 18480 (26%) | |
200K+ | 636 (36%) | 4574 (20%) | 14440 (20%) | |
Highest Education Level | No Diploma | 94 | 1676 | 7632 |
Diploma or GED | 450 | 7400 | 23999 | |
Some College | 517 | 7766 | 22474 | |
Assoc. Degree | 188 | 2544 | 8380 | |
Bachelors Degree | 1036 | 12304 | 38196 | |
Higher Degree | 924 | 9822 | 28870 | |
Total Housing Units | 1,858 | 24,319 | 75,408 | |
--Owner-Occupied | 1,555 | 18,429 | 54,071 | |
--Renter-Occupied | 179 | 4,392 | 16,516 | |
Owner-Occupied Values | < 100K | 58 | 1070 | 3150 |
100-199K | 134 | 2802 | 7704 | |
200-299K | 159 | 3295 | 10016 | |
300-399K | 237 | 3423 | 10119 | |
400-499K | 304 | 1923 | 5371 | |
500K+ | 663 | 5915 | 17712 | |
Total Working Age Population | 3,383 | 45,962 | 146,935 | |
In Work Force | 2,027 | 28,178 | 94,171 | |
Not In Work Force | 1,355 | 17,784 | 52,764 | |
Workforce Employed | 1,965 | 26,997 | 90,036 | |
Workforce Unemployed | 62 | 1,170 | 4,121 | |
Civlian Workforce | 2,027 | 28,168 | 94,158 | |
Military Workforce | 0 | 11 | 13 | |
Total Households | 1,735 | 22,821 | 70,587 | |
Family Households | 1,168 | 15,441 | 49,033 | |
Non-Family Households | 567 | 7,380 | 21,554 | |
Married Couple | 1,065 | 12,609 | 39,726 | |
Other Family | 103 | 2,832 | 9,307 | |
Married w/Child | 340 | 4,416 | 16,726 | |
Single Male w/Child | 9 | 190 | 939 | |
Single Female w/Child | 19 | 916 | 3,173 |
Population Change Last Two Decades - Plus Projection
2000 | % | 2010 | % | 2020 | % | 2030 | |
---|---|---|---|---|---|---|---|
Illinois | 12,419,293 | +3 | 12,830,632 | +12 | 14,316,487 | +6 | 15,138,849 |
Cook County | 5,376,741 | -3 | 5,194,675 | +10 | 5,707,832 | +5 | 5,990,243 |
DuPage County | 904,161 | +1 | 916,924 | +10 | 1,010,323 | +2 | 1,034,039 |
Will County | 502,266 | +35 | 677,560 | +34 | 907,625 | +20 | 1,093,207 |
Total Working Age Population:
Total Households:
Total Working Age Population:
Total Households:
Total Working Age Population:
Total Households: