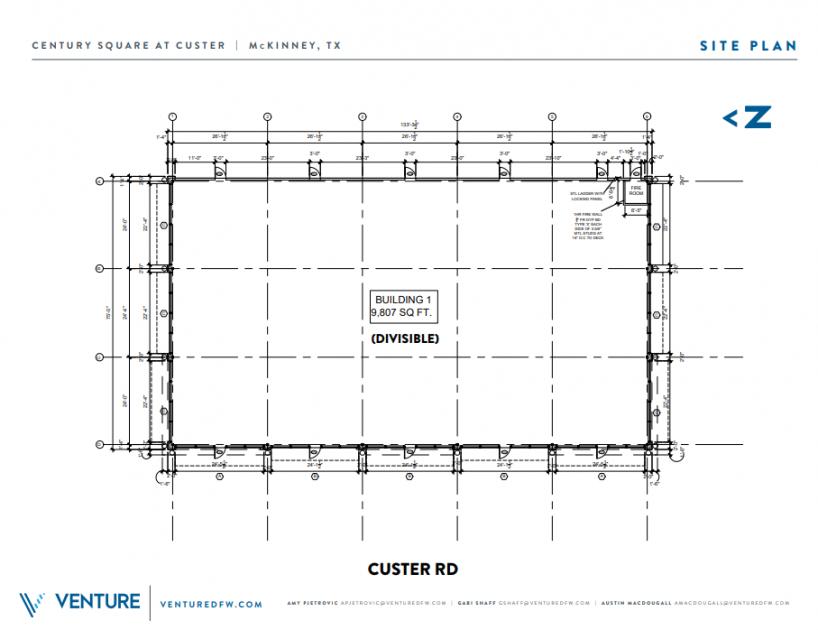
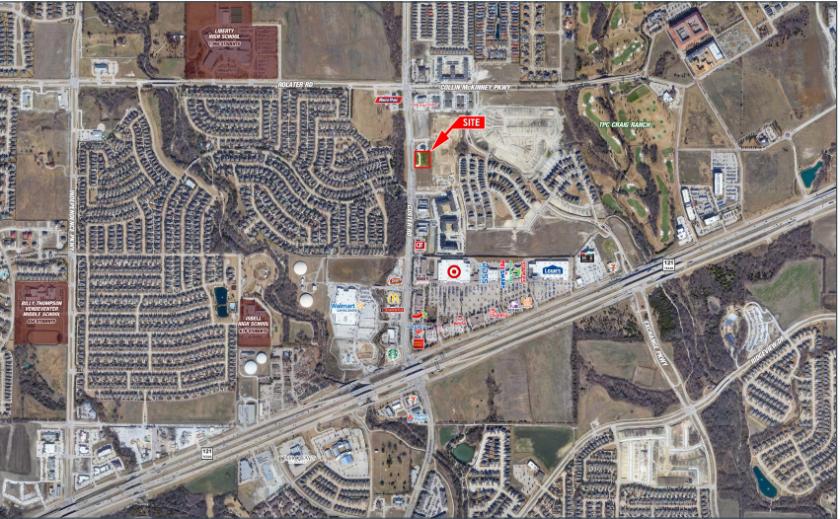
1-Mile | 3-Miles | 5-Miles | ||
---|---|---|---|---|
Total Population | 12,914 | 108,551 | 272,814 | |
Population Median Age | 33 | 34 | 35 | |
Population by Age | 0-9 Yrs | 2225 (17%) | 18512 (17%) | 42580 (15%) |
10-19 Yrs | 2028 (15%) | 17836 (16%) | 45416 (16%) | |
20-29 Yrs | 1053 (8%) | 8823 (8%) | 23241 (8%) | |
30-39 Yrs | 2360 (18%) | 17522 (16%) | 40216 (14%) | |
40-49 Yrs | 2522 (19%) | 21140 (19%) | 53677 (19%) | |
50-59 Yrs | 1255 (9%) | 12131 (11%) | 33514 (12%) | |
60-69 Yrs | 877 (6%) | 7198 (6%) | 19411 (7%) | |
70+ Yrs | 593 (4%) | 5389 (4%) | 14759 (5%) | |
Median HH Income | $118,189 | $118,930 | $116,904 | |
Total Household Income | < 24K | 465 (10%) | 2043 (5%) | 5763 (6%) |
25-49K | 345 (7%) | 3543 (9%) | 10260 (11%) | |
50-74K | 525 (12%) | 4596 (12%) | 11859 (12%) | |
75-99K | 579 (13%) | 4578 (12%) | 11403 (12%) | |
100-199K | 1485 (34%) | 14305 (39%) | 35049 (37%) | |
200K+ | 951 (21%) | 7080 (19%) | 18475 (19%) | |
Highest Education Level | No Diploma | 135 | 1919 | 5204 |
Diploma or GED | 921 | 7382 | 18424 | |
Some College | 1200 | 12361 | 31371 | |
Assoc. Degree | 533 | 5078 | 13513 | |
Bachelors Degree | 3325 | 25041 | 65143 | |
Higher Degree | 1949 | 16037 | 39359 | |
Total Housing Units | 4,456 | 38,008 | 97,528 | |
--Owner-Occupied | 2,956 | 26,811 | 66,509 | |
--Renter-Occupied | 1,395 | 9,335 | 26,299 | |
Owner-Occupied Values | < 100K | 25 | 410 | 905 |
100-199K | 43 | 1206 | 3805 | |
200-299K | 652 | 7282 | 17820 | |
300-399K | 820 | 7908 | 20109 | |
400-499K | 575 | 4979 | 12730 | |
500K+ | 841 | 5026 | 11140 | |
Total Working Age Population | 9,322 | 77,536 | 199,674 | |
In Work Force | 6,796 | 56,504 | 144,515 | |
Not In Work Force | 2,527 | 21,032 | 55,159 | |
Workforce Employed | 6,533 | 54,717 | 139,606 | |
Workforce Unemployed | 260 | 1,739 | 4,697 | |
Civlian Workforce | 6,793 | 56,456 | 144,304 | |
Military Workforce | 3 | 48 | 211 | |
Total Households | 4,351 | 36,145 | 92,808 | |
Family Households | 3,313 | 29,151 | 73,306 | |
Non-Family Households | 1,038 | 6,994 | 19,502 | |
Married Couple | 2,876 | 24,928 | 62,363 | |
Other Family | 437 | 4,223 | 10,944 | |
Married w/Child | 1,864 | 15,611 | 37,539 | |
Single Male w/Child | 94 | 659 | 1,761 | |
Single Female w/Child | 204 | 2,062 | 5,150 |
Population Change Last Two Decades - Plus Projection
2000 | % | 2010 | % | 2020 | % | 2030 | |
---|---|---|---|---|---|---|---|
Texas | 20,851,820 | +21 | 25,145,561 | +18 | 29,677,668 | +18 | 34,894,452 |
Collin County | 491,675 | +59 | 782,341 | +33 | 1,039,369 | +34 | 1,391,461 |
Total Working Age Population:
Total Households:
Total Working Age Population:
Total Households:
Total Working Age Population:
Total Households: