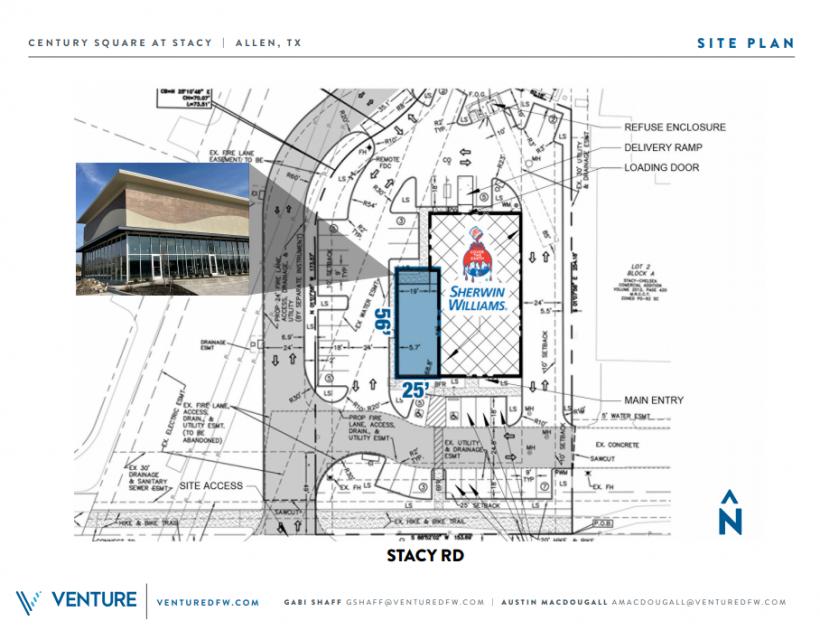
U N D E R C O N S T R U C T I O N - D E L I V E R Y
FEBRUARY 2021
C L O S E P R O X I M I T Y T O T H E A L L E N
PREMIUM OUTLETS
A C R O S S F R O M S T A C Y G R E E N M I X E D
U S E D E V E L O P M E N T W H I C H W I L L A D D
3 2 6 M F U N I T S , 1 5 0 , 0 0 0 S F O F O F F I C E ,
88 TOWNHOMES, A HOTEL AND MORE
L O C A T E D A T O N E O F T H E P R E M I E R
RETAIL INTERSECTIONS IN ALLEN
EASY ACCESS TO HWY 75
No part of this information may be copied, reproduced, repurposed, or screen-captured for any commercial purpose without prior written authorization from MyEListing.
While we strive to provide the most accurate information, all listing information, and demographic data, is provided by third-parties. As such, MyEListing will not be responsible for the accuracy of the information. It is strongly recommended that you verify all information with the listing agent, and any relevant agencies, prior to making any decisions.
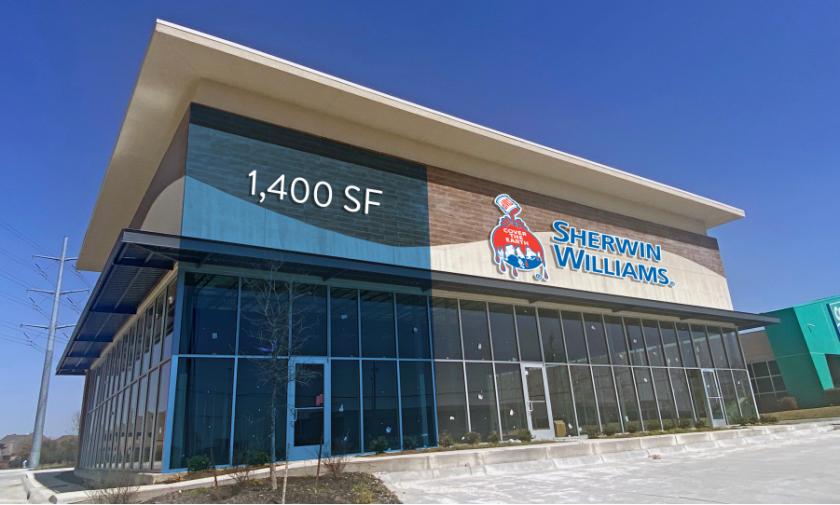
What is the building size of this commercial Retail property?
The size of this lease property at '.852 West Stacy Road.' is 1400 square feet
What kind of Retail is the propery at 852 West Stacy Road?
The property at 852 West Stacy Road Allen, TX 75013 is listed as a Shopping Center Retail property
What is the population within 1 mile of 852 West Stacy Road in Allen?
The population within 1 mile of 852 West Stacy Road Allen, TX 75013 is 6,493 people.
Who do I contact for questions about 852 West Stacy Road?
You should contact the listing agent,
Austin MacDougall, for any details regarding this commercial listing.