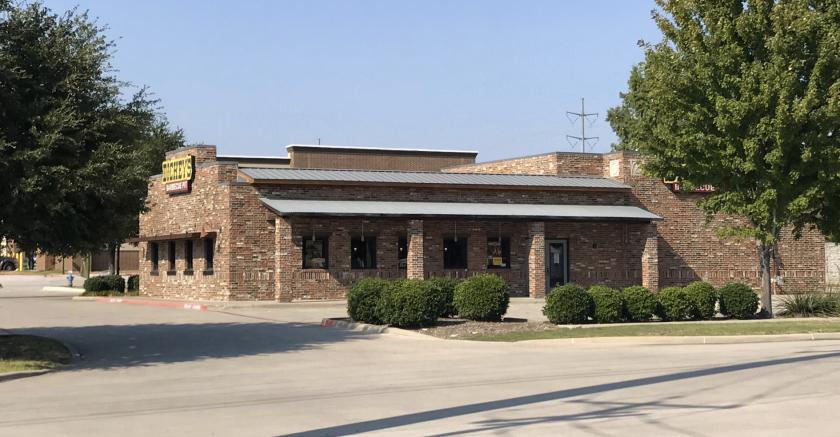
Retail Space
600 North Central Expressway McKinney, TX 75070
600 North Central Expressway McKinney, TX 75070
Details & Description
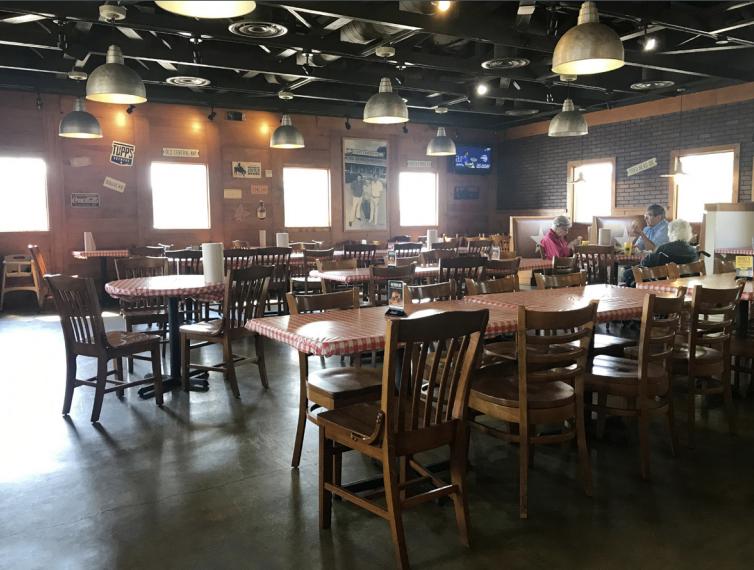
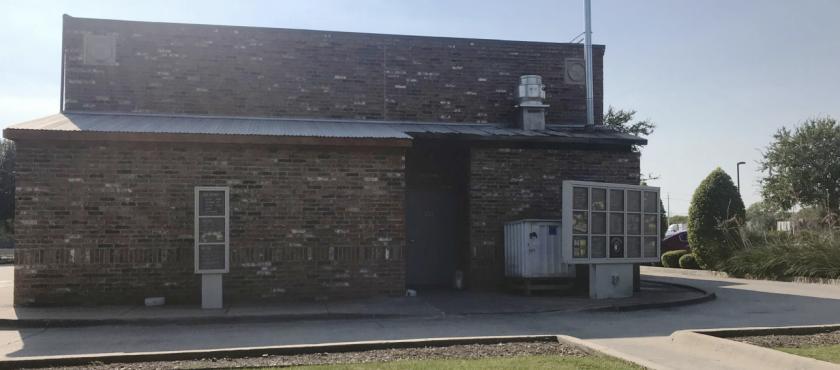
Additional Photos

Listing Agents

John Day
O: 214-378-1212
jday@venturedfw.com
O: 214-378-1212
jday@venturedfw.com
While we strive to provide the most accurate information, all listing information, and demographic data, is provided by third-parties. As such, MyEListing will not be responsible for the accuracy of the information. It is strongly recommended that you verify all information with the listing agent, and any relevant agencies, prior to making any decisions.


