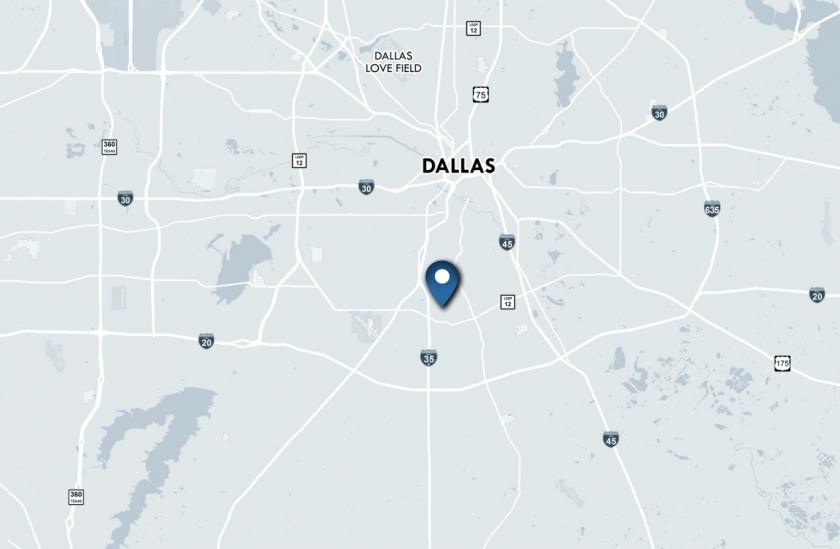
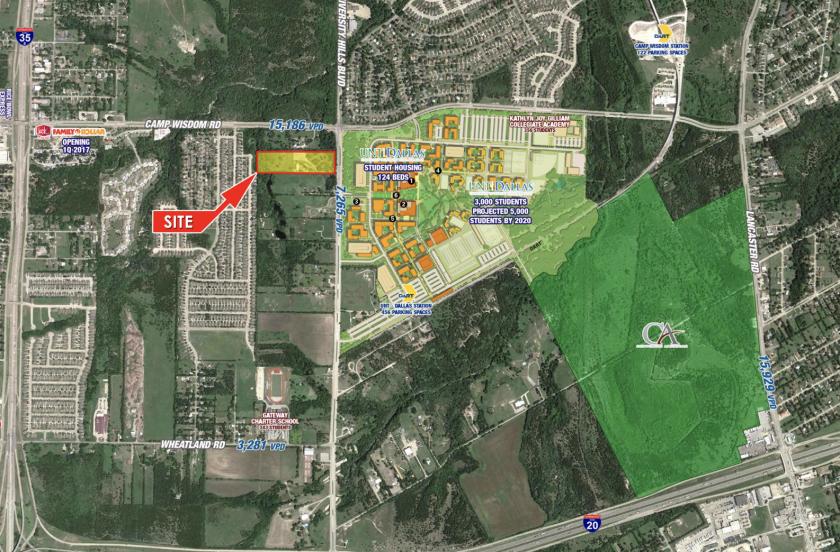
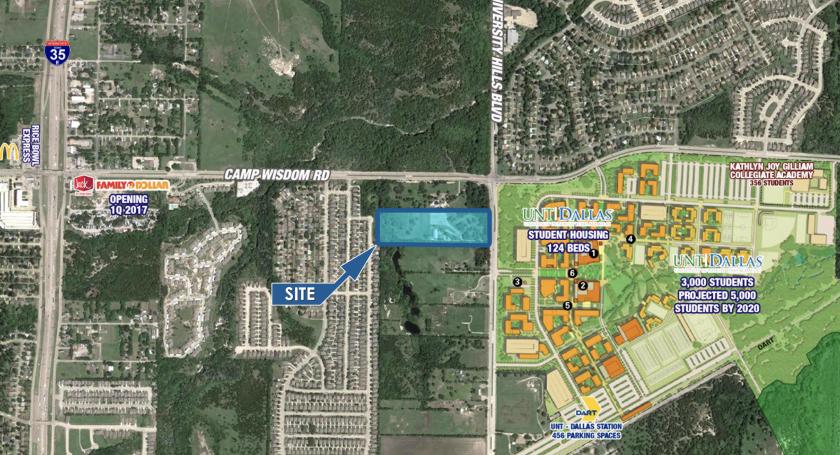
1-Mile | 3-Miles | 5-Miles | ||
---|---|---|---|---|
Total Population | 4,939 | 78,885 | 233,063 | |
Population Median Age | 38 | 37 | 35 | |
Population by Age | 0-9 Yrs | 426 (8%) | 10114 (12%) | 37107 (15%) |
10-19 Yrs | 852 (17%) | 13014 (16%) | 36447 (15%) | |
20-29 Yrs | 798 (16%) | 10902 (13%) | 33154 (14%) | |
30-39 Yrs | 780 (15%) | 9814 (12%) | 29632 (12%) | |
40-49 Yrs | 323 (6%) | 9360 (11%) | 26745 (11%) | |
50-59 Yrs | 821 (16%) | 9510 (12%) | 28414 (12%) | |
60-69 Yrs | 503 (10%) | 7534 (9%) | 21821 (9%) | |
70+ Yrs | 435 (8%) | 8637 (10%) | 19744 (8%) | |
Median HH Income | $34,292 | $36,615 | $37,906 | |
Total Household Income | < 24K | 772 (41%) | 9653 (35%) | 27811 (34%) |
25-49K | 450 (23%) | 8129 (29%) | 23487 (28%) | |
50-74K | 329 (17%) | 3968 (14%) | 13254 (16%) | |
75-99K | 159 (8%) | 2614 (9%) | 7438 (9%) | |
100-199K | 161 (8%) | 2924 (10%) | 8345 (10%) | |
200K+ | 11 (0%) | 276 (1%) | 1163 (1%) | |
Highest Education Level | No Diploma | 635 | 11263 | 33758 |
Diploma or GED | 1091 | 17474 | 47089 | |
Some College | 837 | 12375 | 34281 | |
Assoc. Degree | 200 | 2342 | 7809 | |
Bachelors Degree | 277 | 4203 | 13363 | |
Higher Degree | 159 | 2536 | 6731 | |
Total Housing Units | 1,998 | 29,756 | 89,327 | |
--Owner-Occupied | 983 | 14,855 | 38,070 | |
--Renter-Occupied | 898 | 12,709 | 43,429 | |
Owner-Occupied Values | < 100K | 404 | 7511 | 17761 |
100-199K | 557 | 5992 | 15616 | |
200-299K | 18 | 961 | 3203 | |
300-399K | 3 | 131 | 604 | |
400-499K | 0 | 31 | 327 | |
500K+ | 0 | 230 | 559 | |
Total Working Age Population | 3,855 | 60,168 | 172,664 | |
In Work Force | 1,922 | 32,595 | 101,632 | |
Not In Work Force | 1,933 | 27,573 | 71,032 | |
Workforce Employed | 1,717 | 30,450 | 94,176 | |
Workforce Unemployed | 205 | 2,144 | 7,404 | |
Civlian Workforce | 1,922 | 32,595 | 101,580 | |
Military Workforce | 0 | 0 | 52 | |
Total Households | 1,881 | 27,565 | 81,499 | |
Family Households | 1,170 | 17,540 | 51,827 | |
Non-Family Households | 710 | 10,025 | 29,671 | |
Married Couple | 514 | 7,998 | 24,241 | |
Other Family | 656 | 9,541 | 27,586 | |
Married w/Child | 107 | 2,800 | 9,681 | |
Single Male w/Child | 11 | 1,051 | 2,791 | |
Single Female w/Child | 388 | 3,493 | 11,572 |
Population Change Last Two Decades - Plus Projection
2000 | % | 2010 | % | 2020 | % | 2030 | |
---|---|---|---|---|---|---|---|
Texas | 20,851,820 | +21 | 25,145,561 | +18 | 29,677,668 | +18 | 34,894,452 |
Dallas County | 2,218,899 | +7 | 2,368,139 | +15 | 2,734,111 | +14 | 3,106,298 |
Total Working Age Population:
Total Households:
Total Working Age Population:
Total Households:
Total Working Age Population:
Total Households: