Take a good look at Sapir Center. We are
centrally located between the highest paying employer in
the state, Sandia Labs, and the highest median income
neighborhood in the state, Tanoan. These potential customers
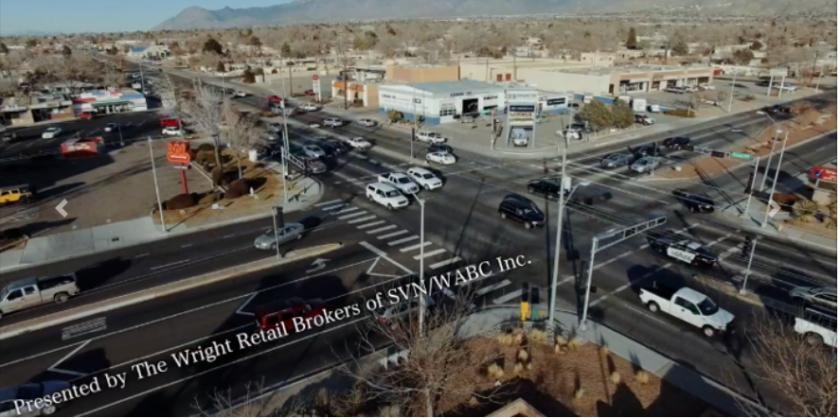
pass Snow Heights Promenade twice everyday; going to work
and then coming home from work. We also have surrounding
rooftops from single family to multifamily buildings. Your
customers are HERE! Bring your business to THRIVE at
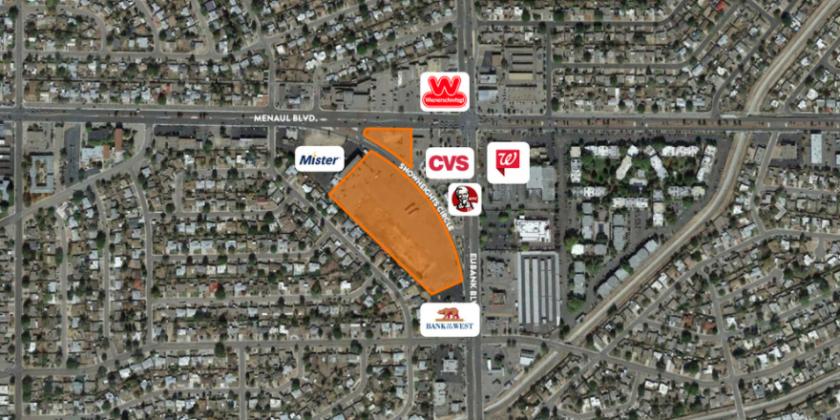
the signalized corner of Eubank & Menaul.
Highlights
Anchor, Jr Anchor, Inline, and Drive Through Pads Available
Adjacent Tenants Include: CVS, KFC,
Bank of the West and Mister Car Wash
Go to our website for more information
www.snowheightspromenade.com
No part of this information may be copied, reproduced, repurposed, or screen-captured for any commercial purpose without prior written authorization from MyEListing.
While we strive to provide the most accurate information, all listing information, and demographic data, is provided by third-parties. As such, MyEListing will not be responsible for the accuracy of the information. It is strongly recommended that you verify all information with the listing agent, and any relevant agencies, prior to making any decisions.
What is the building size of this commercial Retail property?
The size of this multi-unit property varies between 900 - 28500 square feet
What kind of Retail is the propery at 2113 Eubank Boulevard Northeast?
The property at 2113 Eubank Boulevard Northeast Albuquerque, NM 87112 is listed as a Shopping Center Retail property
What is the population within 1 mile of 2113 Eubank Boulevard Northeast in Albuquerque?
The population within 1 mile of 2113 Eubank Boulevard Northeast Albuquerque, NM 87112 is 18,403 people.
Who do I contact for questions about 2113 Eubank Boulevard Northeast?
You should contact the listing agent,
Walt Arnold, for any details regarding this commercial listing.