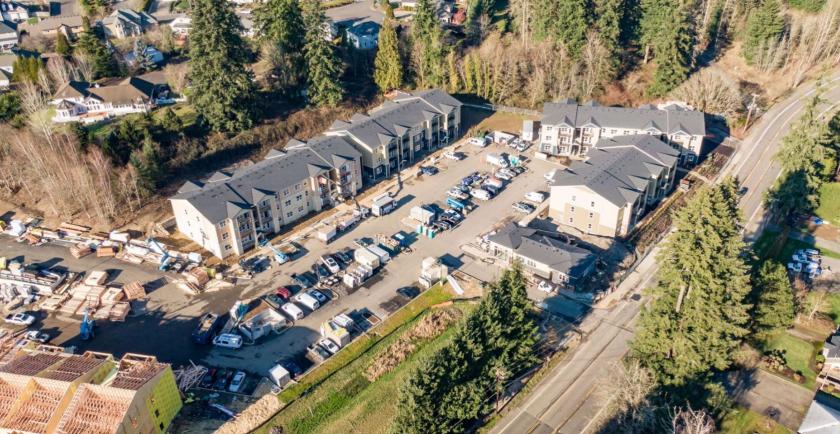
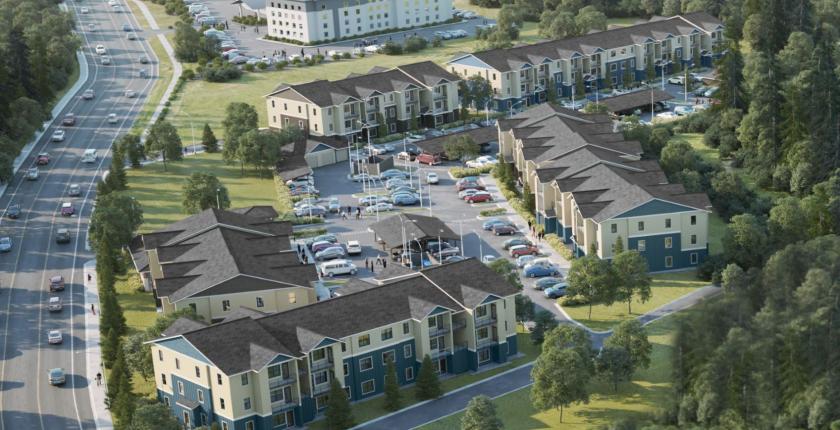
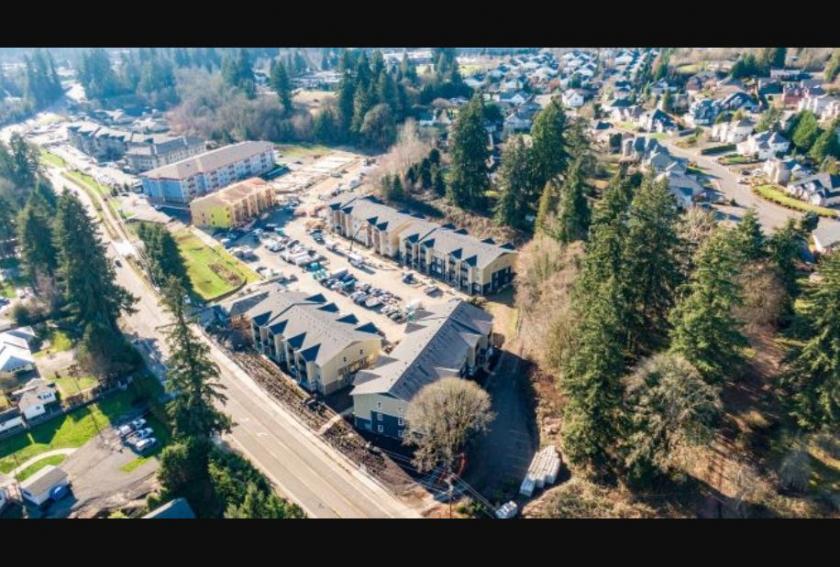
1-Mile | 3-Miles | 5-Miles | ||
---|---|---|---|---|
Total Population | 7,572 | 54,492 | 138,115 | |
Population Median Age | 41 | 40 | 40 | |
Population by Age | 0-9 Yrs | 811 (10%) | 6496 (11%) | 17480 (12%) |
10-19 Yrs | 923 (12%) | 7133 (13%) | 17477 (12%) | |
20-29 Yrs | 1063 (14%) | 6129 (11%) | 16678 (12%) | |
30-39 Yrs | 772 (10%) | 6426 (11%) | 16624 (12%) | |
40-49 Yrs | 1037 (13%) | 7328 (13%) | 18255 (13%) | |
50-59 Yrs | 1110 (14%) | 7981 (14%) | 20155 (14%) | |
60-69 Yrs | 902 (11%) | 7275 (13%) | 16860 (12%) | |
70+ Yrs | 954 (12%) | 5724 (10%) | 14585 (10%) | |
Median HH Income | $85,906 | $85,042 | $79,961 | |
Total Household Income | < 24K | 267 (8%) | 2170 (10%) | 5981 (11%) |
25-49K | 512 (17%) | 3454 (16%) | 9125 (17%) | |
50-74K | 523 (17%) | 3493 (17%) | 9119 (17%) | |
75-99K | 459 (15%) | 2874 (13%) | 7755 (15%) | |
100-199K | 1047 (34%) | 6969 (33%) | 15912 (30%) | |
200K+ | 196 (6%) | 1584 (7%) | 3636 (7%) | |
Highest Education Level | No Diploma | 223 | 2138 | 6378 |
Diploma or GED | 928 | 7609 | 22196 | |
Some College | 1465 | 10310 | 25655 | |
Assoc. Degree | 528 | 3874 | 10408 | |
Bachelors Degree | 1291 | 9035 | 20281 | |
Higher Degree | 848 | 4739 | 10513 | |
Total Housing Units | 3,098 | 21,308 | 53,696 | |
--Owner-Occupied | 2,072 | 15,097 | 37,115 | |
--Renter-Occupied | 932 | 5,447 | 14,413 | |
Owner-Occupied Values | < 100K | 100 | 678 | 1620 |
100-199K | 157 | 1062 | 3024 | |
200-299K | 412 | 3691 | 10958 | |
300-399K | 603 | 4793 | 10489 | |
400-499K | 399 | 2692 | 5888 | |
500K+ | 401 | 2181 | 5137 | |
Total Working Age Population | 6,154 | 43,710 | 109,921 | |
In Work Force | 3,833 | 27,726 | 70,556 | |
Not In Work Force | 2,321 | 15,984 | 39,365 | |
Workforce Employed | 3,599 | 26,434 | 66,914 | |
Workforce Unemployed | 222 | 1,261 | 3,515 | |
Civlian Workforce | 3,821 | 27,695 | 70,429 | |
Military Workforce | 11 | 31 | 128 | |
Total Households | 3,004 | 20,545 | 51,528 | |
Family Households | 2,161 | 14,858 | 36,808 | |
Non-Family Households | 843 | 5,687 | 14,720 | |
Married Couple | 1,714 | 12,137 | 29,283 | |
Other Family | 447 | 2,721 | 7,526 | |
Married w/Child | 616 | 4,553 | 11,102 | |
Single Male w/Child | 136 | 474 | 1,107 | |
Single Female w/Child | 74 | 872 | 2,594 |
Population Change Last Two Decades - Plus Projection
2000 | % | 2010 | % | 2020 | % | 2030 | |
---|---|---|---|---|---|---|---|
Oregon | 3,421,399 | +12 | 3,831,074 | +11 | 4,264,810 | +11 | 4,727,438 |
Multnomah County | 660,486 | +11 | 735,334 | +12 | 822,675 | +10 | 906,904 |
Washington | 5,894,121 | +14 | 6,724,540 | +14 | 7,638,415 | +11 | 8,503,178 |
Clark County | 345,238 | +23 | 425,363 | +17 | 499,400 | +16 | 576,879 |
Total Working Age Population:
Total Households:
Total Working Age Population:
Total Households:
Total Working Age Population:
Total Households: