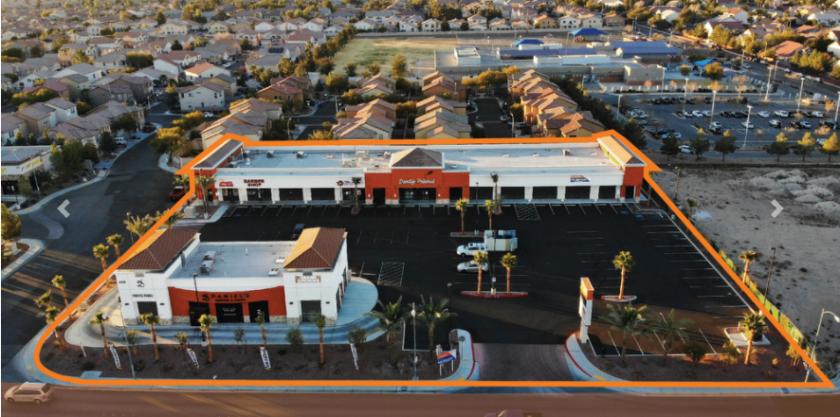
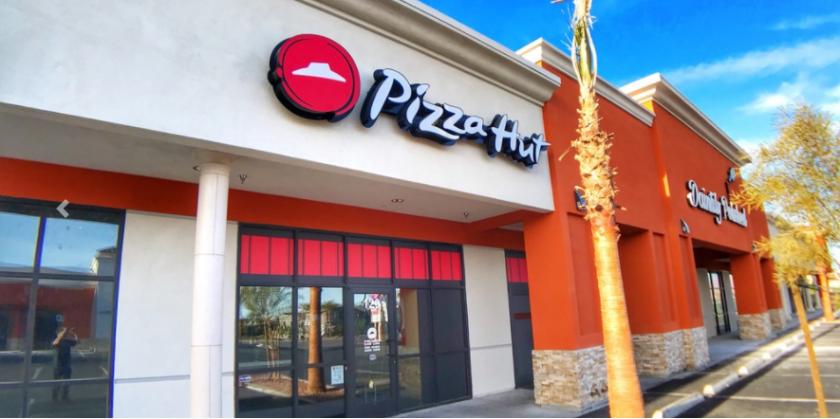
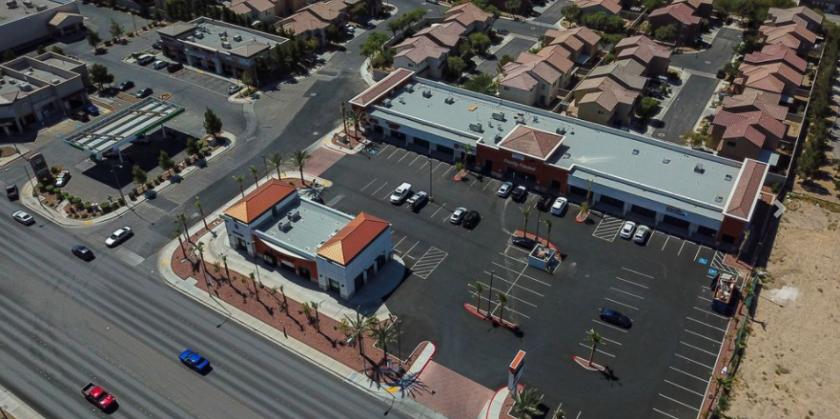
Please contact David Houle (702-527-7547 / david.houle@svn.com) or Carlos Moreno (702-527-7652 / carlos.moreno@svn.com) to schedule on site tours.SVN | The Equity Group is pleased to exclusively offer for sale: Silverado Gallery (the “Property”), a ±19,120 SF neighborhood retail center located in the Silverado Ranch suburb of Las Vegas.Built in 2019, the Property consists of two buildings situated on a ±1.9-acre site at 335-345 E. Silverado Ranch Boulevard. 345 E. Silverado Ranch, the larger of the two structures, contains ±15,120 SF and is currently divided into six in-line suites. The smaller building, 335 E. Silverado Ranch, is a ±4,000 SF drive-thru building with two-suites. The Property features highly-visible pylon signage, an on-site community grease trap, and an ±84-stall paved parking lot.Silverado Gallery is strategically positioned along on Silverado Ranch Boulevard in South Las Vegas, with strong traffic counts of approximately 30,000 VPD (Vehicles Per Day). The site is located within the immediate vicinity of single family residences, a multitude of apartment complexes, retail centers, recreational parks, and public schools. In addition, the Property is situated perpendicularly across the street from a new ±19-acre multi-family development.Highlights19,120 square foot retail centerNo State Income Tax2019 constructionAnnual rent increasesMature Las Vegas Sub-MarketGreat mix of tenants