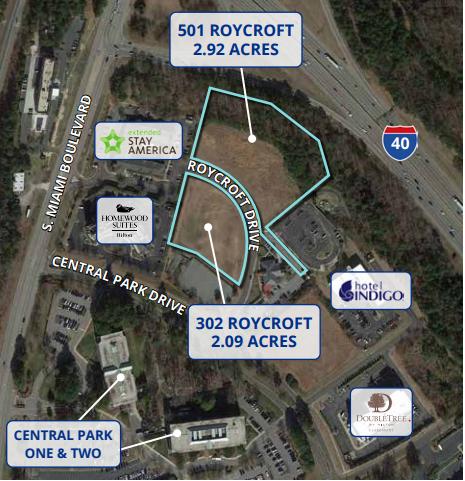
Parcels ideal for office or high-density townhomes
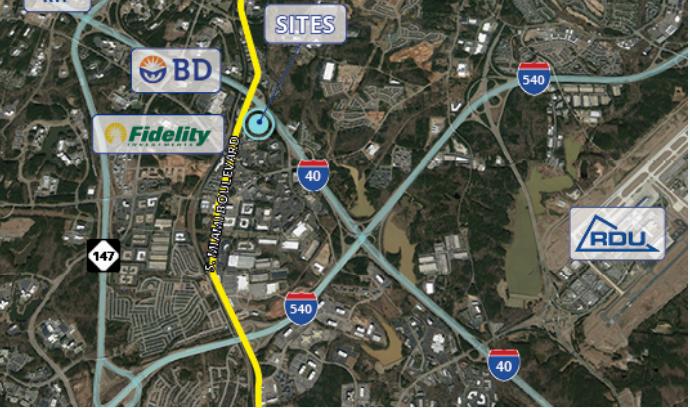
Located just off I-40 & S. Miami Boulevard
188,000 annual average daily traffic at the intersection
Exceptional access to Research Triangle Park (RTP) and Raleigh-Durham
International Airport (RDU)
Six points of ingress and egress
2,000 feet of frontage on I-40
Located north of Central Park One & Two, 225,000 square feet of office space
Numerous restaurants, hotels, and retail shops within immediate area
No part of this information may be copied, reproduced, repurposed, or screen-captured for any commercial purpose without prior written authorization from MyEListing.
While we strive to provide the most accurate information, all listing information, and demographic data, is provided by third-parties. As such, MyEListing will not be responsible for the accuracy of the information. It is strongly recommended that you verify all information with the listing agent, and any relevant agencies, prior to making any decisions.
What is the asking price for 501 Roycroft Dr in Morrisville?
The asking price for 501 Roycroft Dr is $795,000
How much land does the Morrisville, NC property at 501 Roycroft Dr include?
501 Roycroft Dr in Morrisville includes 2.920 acres of land
What kind of Land is the propery at 501 Roycroft Dr?
The property at 501 Roycroft Dr Morrisville, NC 27560 is listed as a Mixed Use Land Land property
What is the population within 1 mile of 501 Roycroft Dr in Morrisville?
The population within 1 mile of 501 Roycroft Dr Morrisville, NC 27560 is 2,745 people.
Who do I contact for questions about 501 Roycroft Dr?
You should contact the listing agent,
Jim Harris, for any details regarding this commercial listing.