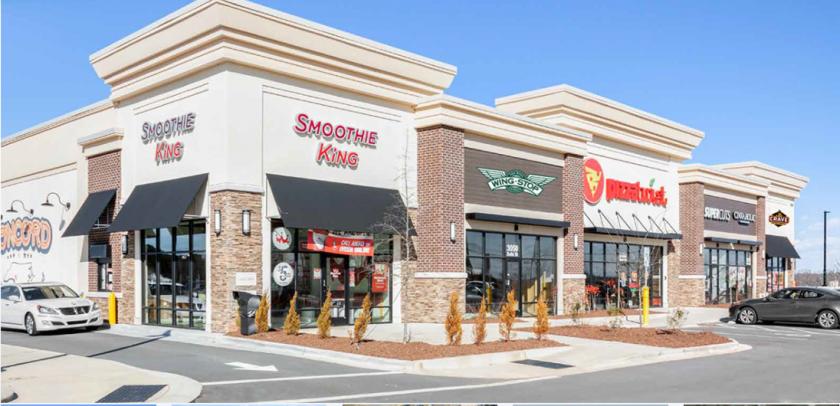
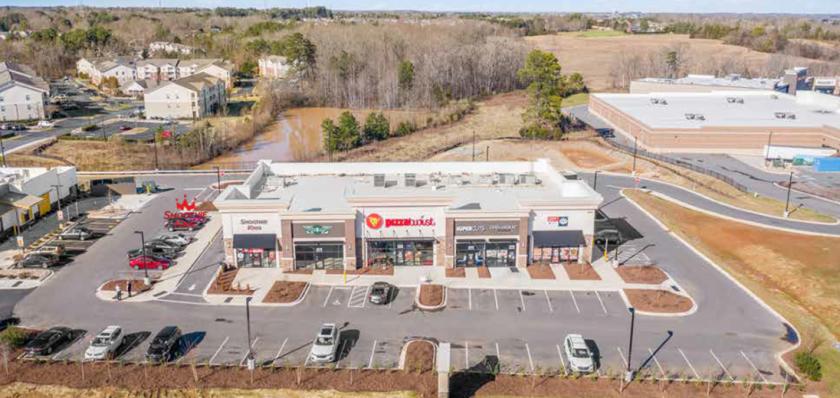
New Construction, 100% leased center with long-term triple net leases
Established Submarket with excellent growth – 36% Growth in last 9 years and 11% projected growth in the next 5 years
Center is 100% comprised of Businesses that are considered Essential Retailers and have been able to remain open during the Covid-19 shutdown
Densely Populated Area (Over 50,000 people in 3-mile Radius)
Affluent sub-market of Charlotte, NC (Average Household income over $102,000 in 3-mile Radius)
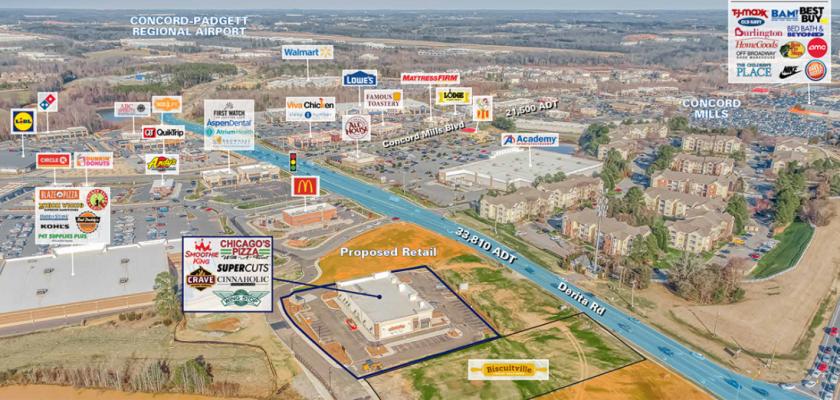
Perfect synergy and shared access with Christenbury Corners, a very prominent shopping center featuring national retailers such as Kohls, Earth Fare, Pet Supplies Plus, McDonalds, Circle K, Bad Daddy’s, First Watch, Aspen Dental and more
Strategic Location – Close proximity to Concord Mills Mall (1.36M SF shopping mall that attracts 17.6 million visitors per-year), Great Wolf Lodge, and Charlotte Motor Speedway
Tremendous Traffic Counts – 21,500 VPD on Concord Mills Blvd and 33,810 VPD on Derita Rd (estimate after road widening)
Shops on Derita services the Highland Creek community – One of the state’s largest master planned communities with over 4,400 homes and 14,000 people across two counties
The Highland Creek community features single family homes ranging from $250,000 to $650,000 and includes a golf course, 5 community pools, and numerous parks and playgrounds