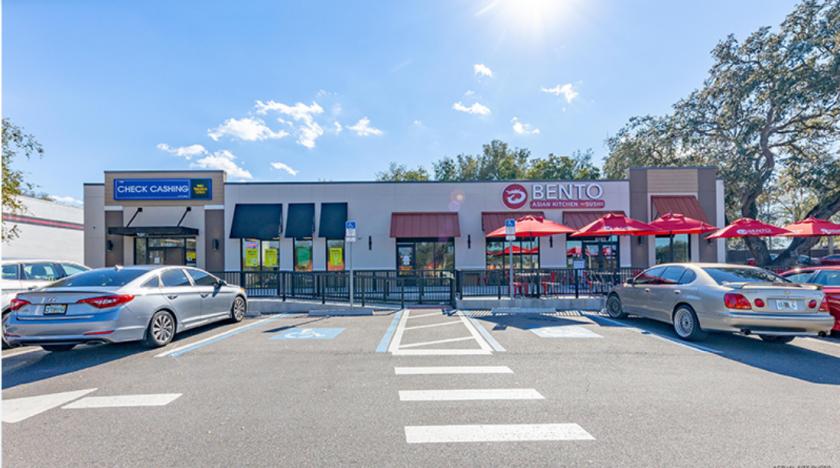
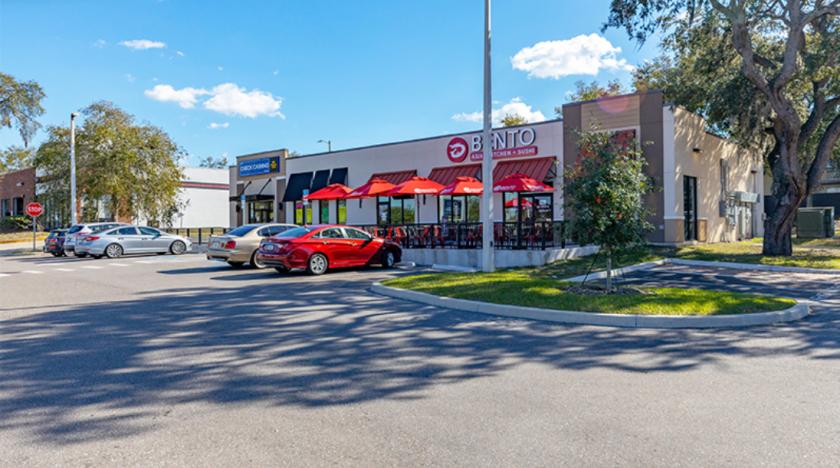
Brand new construction with long-term leases
Prime retail location along Fowler Ave. which carries over 65,000 cars/day
Strategic location across from the 4th largest public University in the state, the University of South Florida which has an enrollment of over 50,000 students
Dense, infill location with high barriers to entry (127,000 residents within 3 miles)
E-commerce resistant tenant mix with below market rents
Excellent underlying real estate fundamentals with a dedicated left hand turn lane and excellent visibility
Fixed 10% rental increases provides inflation hedge
Expense recoveries are NNN, tenants reimburse for CAM, Taxes, Insurance, Management & Admin Fees
51,000 people moved to the Tampa area in 2018 making it the 9th fastest growing MSA in the U.S.
Florida has no state income tax
No part of this information may be copied, reproduced, repurposed, or screen-captured for any commercial purpose without prior written authorization from MyEListing.
While we strive to provide the most accurate information, all listing information, and demographic data, is provided by third-parties. As such, MyEListing will not be responsible for the accuracy of the information. It is strongly recommended that you verify all information with the listing agent, and any relevant agencies, prior to making any decisions.
What is the asking price for 5105 East Fowler Avenue in Tampa?
The asking price for 5105 East Fowler Avenue is $2,707,676
What is the building size of this Retail property in Tampa, FL?
The size of the building/unit at 5105 East Fowler Avenue in Tampa is 4,837 square feet
How much land does the Tampa, FL property at 5105 East Fowler Avenue include?
5105 East Fowler Avenue in Tampa includes 0.850 acres of land
What kind of Retail is the propery at 5105 East Fowler Avenue?
The property at 5105 East Fowler Avenue Tampa, FL 33617 is listed as a Free Standing Building Retail property
What is the population within 1 mile of 5105 East Fowler Avenue in Tampa?
The population within 1 mile of 5105 East Fowler Avenue Tampa, FL 33617 is 14,481 people.
Who do I contact for questions about 5105 East Fowler Avenue?
You should contact the listing agent,
Patrick Wagor, for any details regarding this commercial listing.