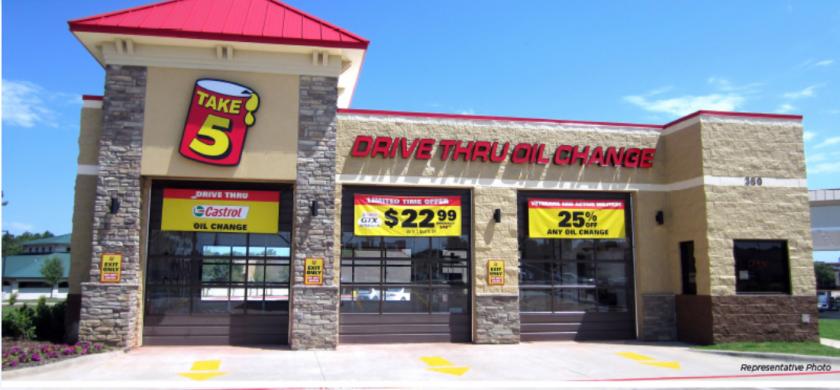
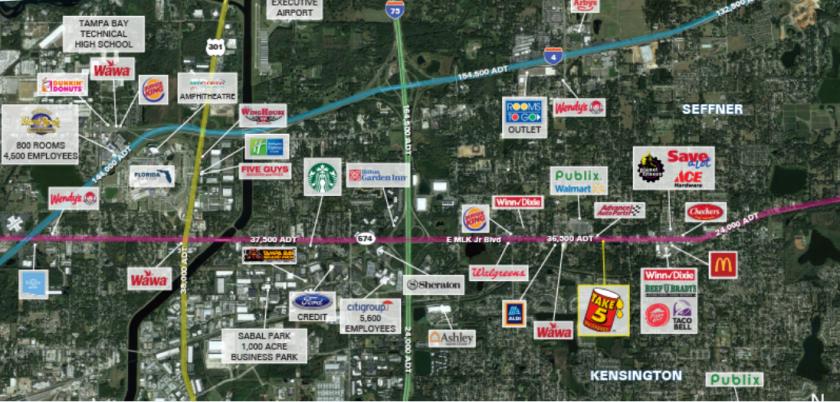
1-Mile | 3-Miles | 5-Miles | ||
---|---|---|---|---|
Total Population | 10,874 | 67,936 | 152,368 | |
Population Median Age | 38 | 38 | 38 | |
Population by Age | 0-9 Yrs | 1326 (12%) | 8417 (12%) | 17860 (11%) |
10-19 Yrs | 1165 (10%) | 8965 (13%) | 19666 (12%) | |
20-29 Yrs | 1485 (13%) | 8326 (12%) | 21419 (14%) | |
30-39 Yrs | 1609 (14%) | 10122 (14%) | 23446 (15%) | |
40-49 Yrs | 1690 (15%) | 8947 (13%) | 20388 (13%) | |
50-59 Yrs | 1545 (14%) | 9487 (13%) | 20288 (13%) | |
60-69 Yrs | 1425 (13%) | 8309 (12%) | 16963 (11%) | |
70+ Yrs | 630 (5%) | 5363 (7%) | 12338 (8%) | |
Median HH Income | $57,720 | $60,592 | $56,905 | |
Total Household Income | < 24K | 804 (21%) | 3877 (16%) | 9603 (17%) |
25-49K | 847 (22%) | 5814 (24%) | 14050 (25%) | |
50-74K | 877 (23%) | 4832 (20%) | 11710 (21%) | |
75-99K | 576 (15%) | 3804 (16%) | 8254 (15%) | |
100-199K | 577 (15%) | 4472 (19%) | 8985 (16%) | |
200K+ | 60 (1%) | 720 (3%) | 1776 (3%) | |
Highest Education Level | No Diploma | 1136 | 5283 | 12246 |
Diploma or GED | 2734 | 15093 | 32180 | |
Some College | 1897 | 10369 | 22617 | |
Assoc. Degree | 673 | 4484 | 10519 | |
Bachelors Degree | 996 | 8722 | 20304 | |
Higher Degree | 319 | 3165 | 8058 | |
Total Housing Units | 4,008 | 25,609 | 59,335 | |
--Owner-Occupied | 2,404 | 15,256 | 30,583 | |
--Renter-Occupied | 1,338 | 8,263 | 23,795 | |
Owner-Occupied Values | < 100K | 420 | 2466 | 5459 |
100-199K | 1251 | 7098 | 13333 | |
200-299K | 529 | 4252 | 8196 | |
300-399K | 162 | 926 | 2225 | |
400-499K | 1 | 206 | 541 | |
500K+ | 41 | 308 | 827 | |
Total Working Age Population | 8,752 | 53,725 | 122,084 | |
In Work Force | 5,364 | 33,482 | 78,028 | |
Not In Work Force | 3,388 | 20,243 | 44,056 | |
Workforce Employed | 4,977 | 31,837 | 73,292 | |
Workforce Unemployed | 387 | 1,571 | 4,441 | |
Civlian Workforce | 5,364 | 33,409 | 77,732 | |
Military Workforce | 0 | 74 | 295 | |
Total Households | 3,742 | 23,519 | 54,378 | |
Family Households | 2,512 | 16,315 | 35,525 | |
Non-Family Households | 1,229 | 7,204 | 18,853 | |
Married Couple | 1,832 | 11,354 | 23,638 | |
Other Family | 680 | 4,961 | 11,887 | |
Married w/Child | 622 | 4,210 | 8,641 | |
Single Male w/Child | 37 | 675 | 1,456 | |
Single Female w/Child | 304 | 2,165 | 5,140 |
Population Change Last Two Decades - Plus Projection
2000 | % | 2010 | % | 2020 | % | 2030 | |
---|---|---|---|---|---|---|---|
Florida | 15,982,378 | +18 | 18,801,310 | +14 | 21,517,610 | +13 | 24,340,457 |
Hillsborough County | 998,948 | +23 | 1,229,226 | +19 | 1,466,803 | +16 | 1,708,550 |
Total Working Age Population:
Total Households:
Total Working Age Population:
Total Households:
Total Working Age Population:
Total Households: