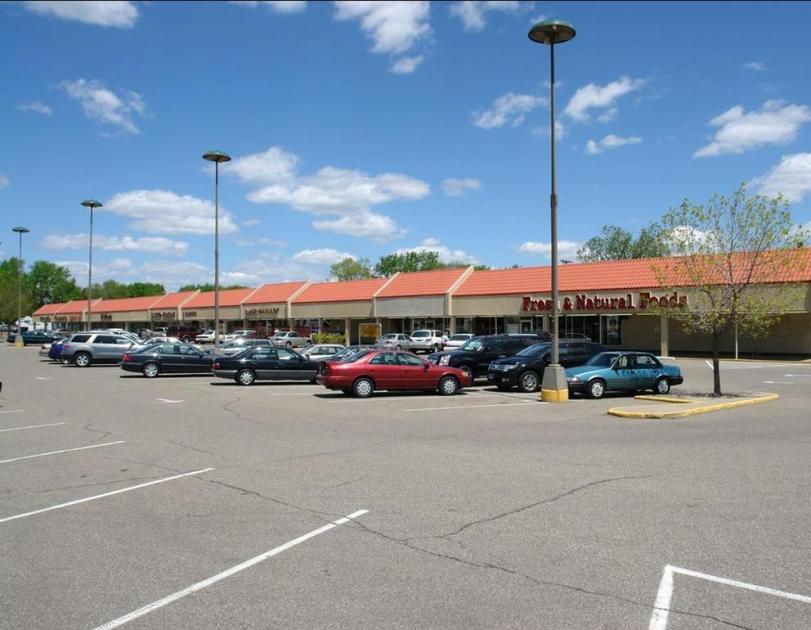
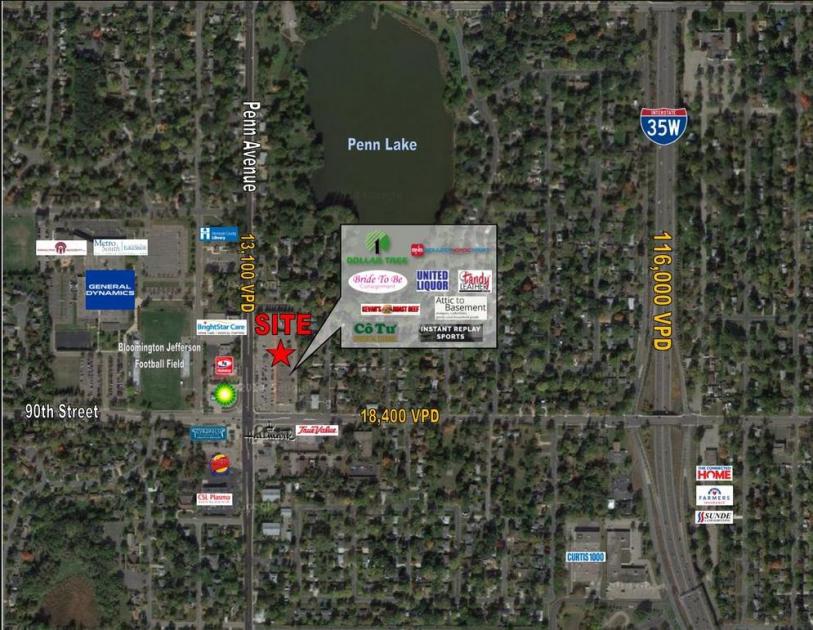
1-Mile | 3-Miles | 5-Miles | ||
---|---|---|---|---|
Total Population | 7,614 | 94,759 | 217,370 | |
Population Median Age | 43 | 41 | 40 | |
Population by Age | 0-9 Yrs | 745 (9%) | 10482 (11%) | 27089 (12%) |
10-19 Yrs | 886 (11%) | 9674 (10%) | 23988 (11%) | |
20-29 Yrs | 904 (11%) | 13206 (13%) | 26454 (12%) | |
30-39 Yrs | 1025 (13%) | 14060 (14%) | 32223 (14%) | |
40-49 Yrs | 851 (11%) | 11181 (11%) | 27694 (12%) | |
50-59 Yrs | 1140 (14%) | 12277 (12%) | 28297 (13%) | |
60-69 Yrs | 831 (10%) | 10814 (11%) | 24945 (11%) | |
70+ Yrs | 1232 (16%) | 13065 (13%) | 26678 (12%) | |
Median HH Income | $77,778 | $71,167 | $80,459 | |
Total Household Income | < 24K | 454 (14%) | 5914 (14%) | 11140 (12%) |
25-49K | 543 (17%) | 8170 (20%) | 16193 (17%) | |
50-74K | 522 (16%) | 7287 (17%) | 15207 (16%) | |
75-99K | 646 (20%) | 5884 (14%) | 11986 (13%) | |
100-199K | 817 (25%) | 10765 (26%) | 25075 (27%) | |
200K+ | 200 (6%) | 2726 (6%) | 10715 (11%) | |
Highest Education Level | No Diploma | 302 | 5499 | 10142 |
Diploma or GED | 1103 | 13718 | 25927 | |
Some College | 1173 | 13685 | 28691 | |
Assoc. Degree | 715 | 6808 | 13517 | |
Bachelors Degree | 1726 | 19964 | 49377 | |
Higher Degree | 636 | 9852 | 28368 | |
Total Housing Units | 3,286 | 42,747 | 94,496 | |
--Owner-Occupied | 2,280 | 24,809 | 60,196 | |
--Renter-Occupied | 902 | 15,936 | 30,121 | |
Owner-Occupied Values | < 100K | 60 | 1421 | 2624 |
100-199K | 362 | 5732 | 10891 | |
200-299K | 1334 | 11169 | 21484 | |
300-399K | 433 | 4118 | 11574 | |
400-499K | 52 | 1238 | 5821 | |
500K+ | 38 | 1132 | 7802 | |
Total Working Age Population | 6,338 | 78,364 | 175,036 | |
In Work Force | 4,115 | 54,367 | 123,643 | |
Not In Work Force | 2,222 | 23,997 | 51,393 | |
Workforce Employed | 4,018 | 52,311 | 119,334 | |
Workforce Unemployed | 97 | 2,041 | 4,233 | |
Civlian Workforce | 4,115 | 54,352 | 123,567 | |
Military Workforce | 0 | 16 | 76 | |
Total Households | 3,182 | 40,745 | 90,317 | |
Family Households | 2,017 | 23,099 | 54,385 | |
Non-Family Households | 1,165 | 17,646 | 35,932 | |
Married Couple | 1,497 | 17,882 | 42,712 | |
Other Family | 519 | 5,218 | 11,672 | |
Married w/Child | 473 | 6,822 | 18,079 | |
Single Male w/Child | 43 | 695 | 1,707 | |
Single Female w/Child | 246 | 1,489 | 4,173 |
Population Change Last Two Decades - Plus Projection
2000 | % | 2010 | % | 2020 | % | 2030 | |
---|---|---|---|---|---|---|---|
Minnesota | 4,919,479 | +8 | 5,303,925 | +7 | 5,687,161 | +5 | 5,974,304 |
Dakota County | 355,904 | +12 | 398,552 | +9 | 434,203 | +7 | 463,564 |
Hennepin County | 1,116,200 | +3 | 1,152,425 | +12 | 1,294,371 | +9 | 1,407,332 |
Scott County | 89,498 | +45 | 129,928 | +18 | 152,927 | +13 | 172,140 |
Total Working Age Population:
Total Households:
Total Working Age Population:
Total Households:
Total Working Age Population:
Total Households: