Office Space
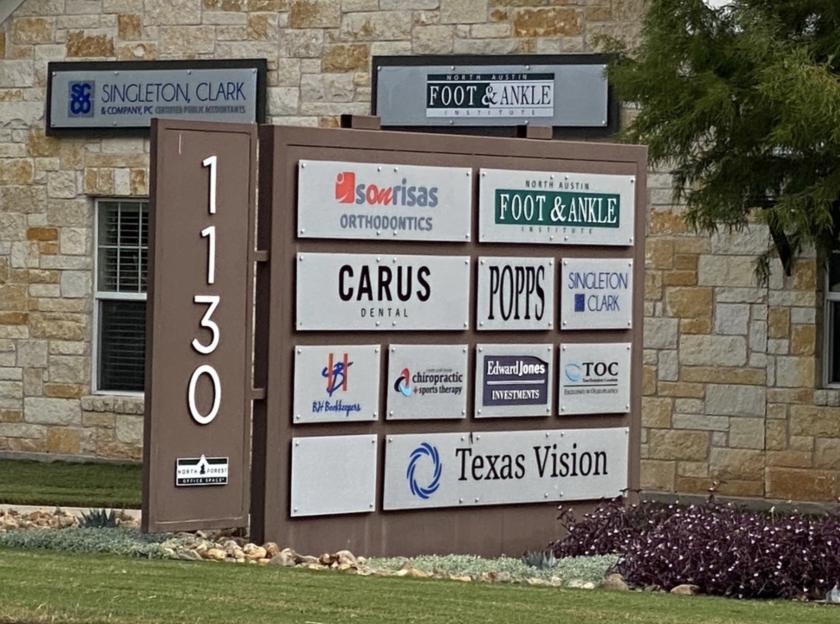
1130 Cottonwood Creek Trail Cedar Park, TX 78613
1130 Cottonwood Creek Trail Cedar Park, TX 78613
Details & Description
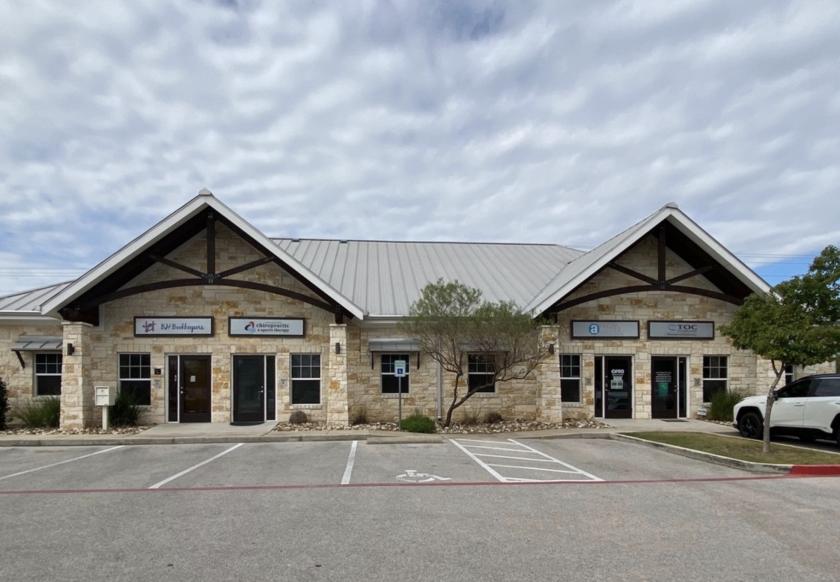
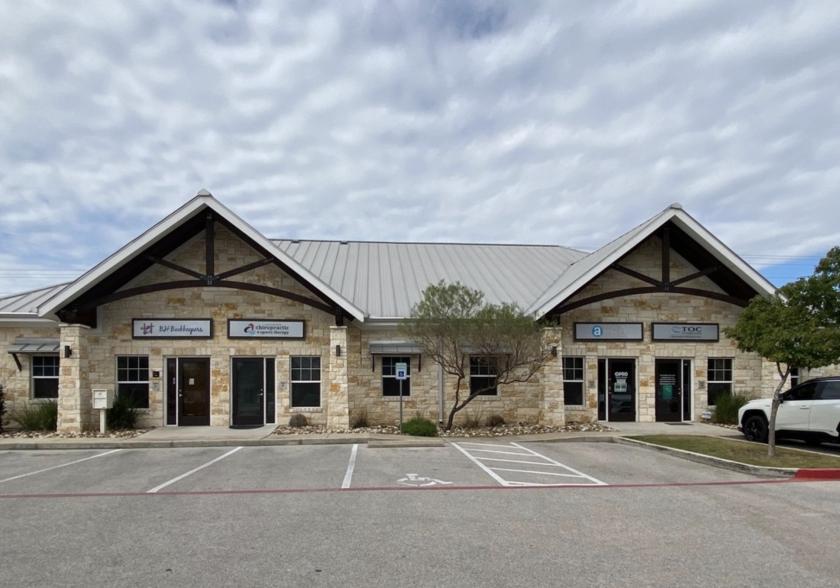
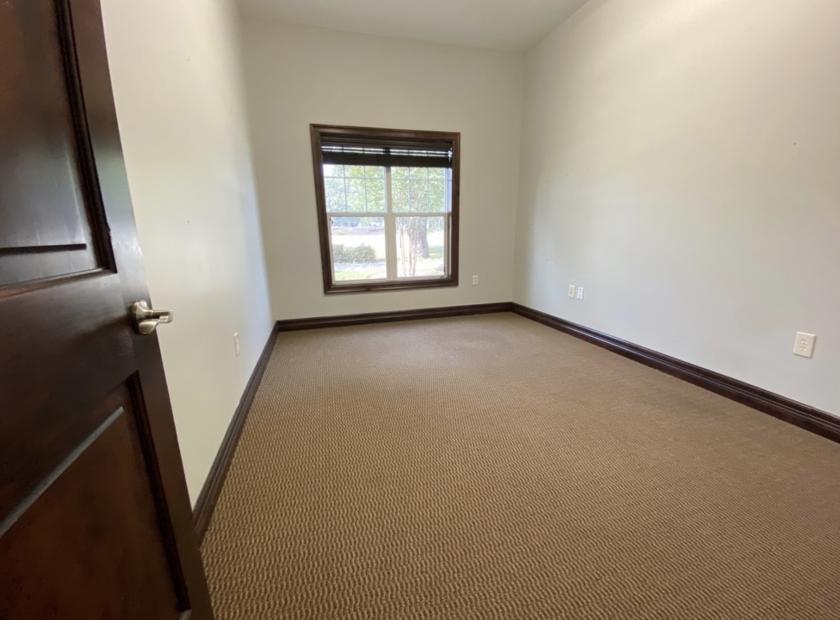
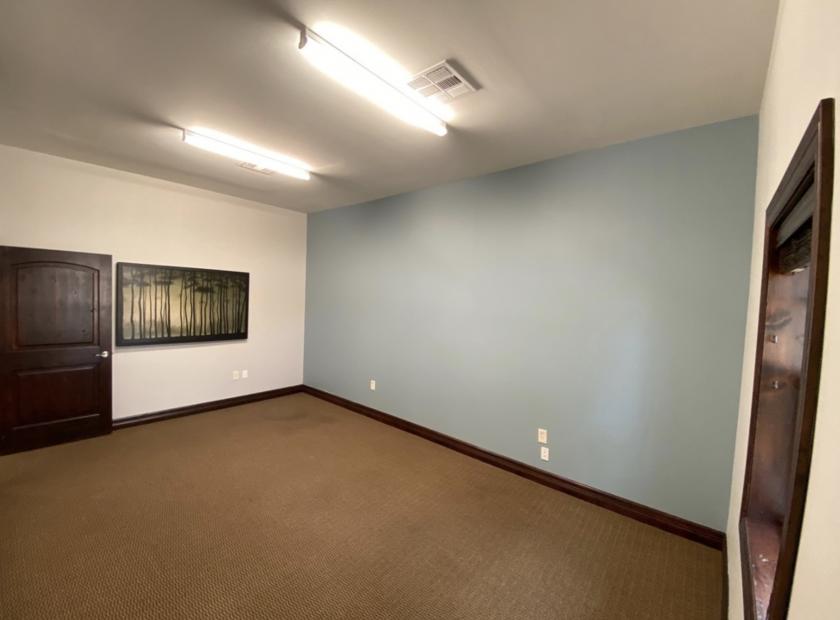
Additional Photos

Listing Agents

Laura Fairbanks
O: 512-448-4111
M: 512-934-3383
laura@fairbankscommercial.com
O: 512-448-4111
M: 512-934-3383
laura@fairbankscommercial.com
While we strive to provide the most accurate information, all listing information, and demographic data, is provided by third-parties. As such, MyEListing will not be responsible for the accuracy of the information. It is strongly recommended that you verify all information with the listing agent, and any relevant agencies, prior to making any decisions.