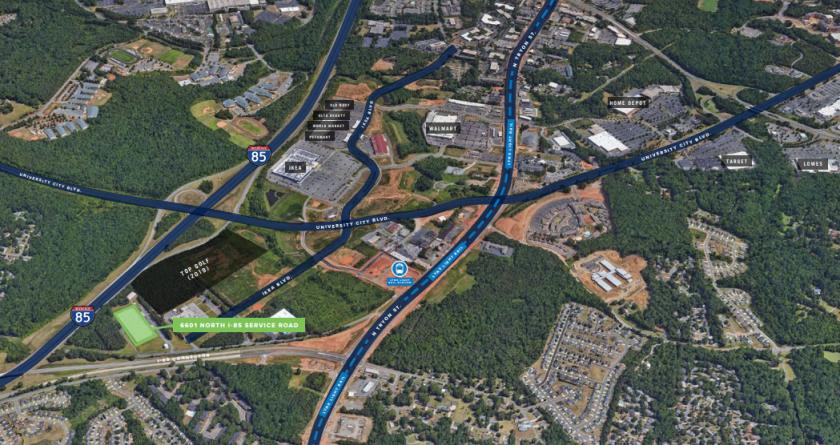
Immediate access to I-85
Next door to new Top Golf development
Surrounded by amenities including restaurants, shopping, and residential
A short walk from the LYNX light rail station
±101,591 SF (200’ x 500’) total
» ±2,080 SF office
» Up to ±14.72 ACRES of land
» 22’ clear height
» 8 dock doors, 7 with hydraulic lifts and seals
» Wet sprinkler system (.35/4,000) full fire loop and 250,000 gallon water tank
» Property is fully fenced
» Property has covered outside storage not included in the square footage
» Improved access to building via I-85
and Ikea Blvd.
» Visibility on I-85 & 29/49 Connector
» 600 AMP 460/480 volt 3 Phase
» 41’8” x 40’ column spacing
» I-1 zoning
» New LED lighting
No part of this information may be copied, reproduced, repurposed, or screen-captured for any commercial purpose without prior written authorization from MyEListing.
While we strive to provide the most accurate information, all listing information, and demographic data, is provided by third-parties. As such, MyEListing will not be responsible for the accuracy of the information. It is strongly recommended that you verify all information with the listing agent, and any relevant agencies, prior to making any decisions.
What is the asking price for 6601 North I - 85 Srv Road in Charlotte?
The asking price for 6601 North I - 85 Srv Road is $4.45 a SF per Year
What is the building size of this commercial Industrial property?
The size of this lease property at '.6601 North I - 85 Srv Road.' is 101591 square feet
What kind of Industrial is the propery at 6601 North I - 85 Srv Road?
The property at 6601 North I - 85 Srv Road Charlotte, NC 28262 is listed as a Warehouse Industrial property
What is the population within 1 mile of 6601 North I - 85 Srv Road in Charlotte?
The population within 1 mile of 6601 North I - 85 Srv Road Charlotte, NC 28262 is 9,746 people.
Who do I contact for questions about 6601 North I - 85 Srv Road?
You should contact the listing agent,
Terry Brennan, for any details regarding this commercial listing.