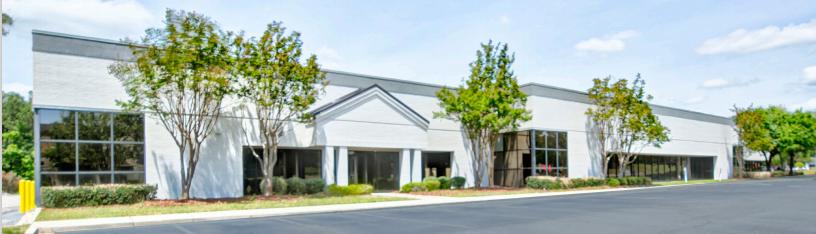
94,020 SF OFFICE/FLEX BUILDING AVAILABLE FOR SALE WITH SUITES AVAILABLE FOR LEASE
Sub dividable up to 10,000 SF
Two story building featuring 68,547 SF (first floor) and 24,891 SF (second floor)
Truly flexible space opportunities, ideal for professional office, medical, or tech firms
Easy conversion to Flex usage with loading capabilities
Signage available: monument and building signage opportunities
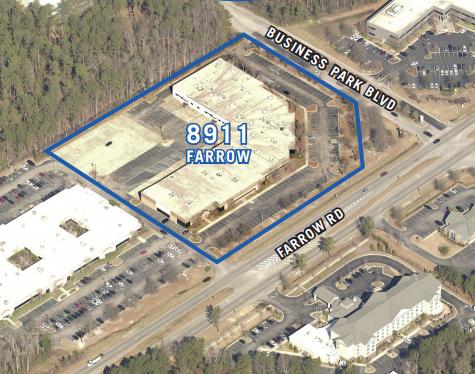
Excellent exposure along Farrow Road, with a daily traffic count of over 27,000 cars
Market Tenant Improvement Allowance available
PARKING
4 per 1,000 parking ratio
Plenty of on-site parking for clients and visitors
ACCESS
At the intersection of Hardscrabble and Farrow Roads
Near I-77, I-20 and Highway 277
Centrally located in the growing Northeast Columbia Sub-market
No part of this information may be copied, reproduced, repurposed, or screen-captured for any commercial purpose without prior written authorization from MyEListing.
While we strive to provide the most accurate information, all listing information, and demographic data, is provided by third-parties. As such, MyEListing will not be responsible for the accuracy of the information. It is strongly recommended that you verify all information with the listing agent, and any relevant agencies, prior to making any decisions.
What is the asking price for 8911 Farrow Road in Columbia?
The asking price for 8911 Farrow Road is $4,000,000
What is the building size of this Office property in Columbia, SC?
The size of the building/unit at 8911 Farrow Road in Columbia is 94,000 square feet
How much land does the Columbia, SC property at 8911 Farrow Road include?
8911 Farrow Road in Columbia includes 4.500 acres of land
What kind of Office is the propery at 8911 Farrow Road?
The property at 8911 Farrow Road Columbia, SC 29203 is listed as a Professional Office property
What is the population within 1 mile of 8911 Farrow Road in Columbia?
The population within 1 mile of 8911 Farrow Road Columbia, SC 29203 is 4,388 people.
Who do I contact for questions about 8911 Farrow Road?
You should contact the listing agent,
Roger Winn, for any details regarding this commercial listing.