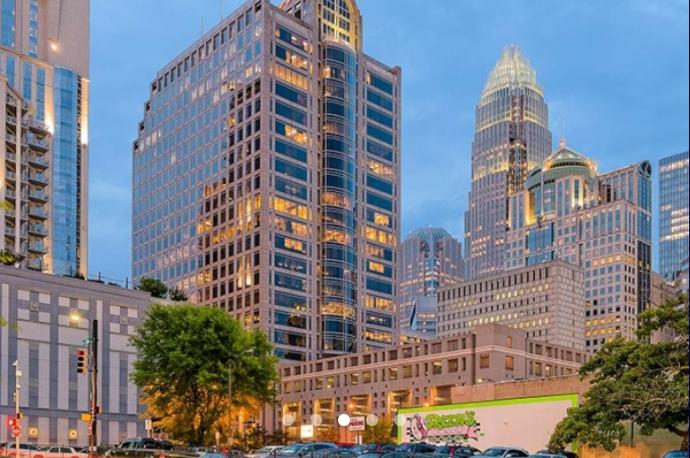
Located within one block of ‘Main & Main’ in Charlotte’s central business district, Carillon is a distinctive icon on the city’s skyline. Featuring dramatic, neo-Gothic architecture and iconic artwork, this Class-A office tower offers tenants a truly exceptional office experience and opportunity to make a striking first impression.
Class A office tower rising 24-stories and featuring 486,994 RSF
Next door to Charlotte's new Grand Bohemian Hotel and Starbucks
Highly efficient 22,000 SF floor plates, providing maximum flexibility for small, medium and large users
9’ floor-to-ceiling windows, maximizing natural light and unobstructed views overlooking BB&T Ballpark and the 5.2-acre Romare Bearden Park
Two-story, picturesque lobby featuring Italian Verona marble floors, a rotating art gallery, and the 40-foot kinetic sculpture “Cascade” by the world-renowned artist Jean Tinguely
10-level attached parking garage, accommodating 814 cars and 3 levels of underground parking
9 high-speed passenger elevators, providing efficient service to the office floors above
LEED Silver-certified and Energy Star-rated, providing an eco-friendly and productive work environment 39% more energy efficient than the average U.S. office building
On-site professional Hines property management dedicated to tenant satisfaction
Amenities
In addition to the building’s impressive stature, classic design and elegant interiors, Carillon offers a wealth of on-site amenities that improve and enhance the Class A office experience.
New onsite amenities include state-of-the-art tenant fitness center featuring Fit Atelier classes and Chop + Chisel cafe
Convenient access to the city’s major transportation arteries I-77, I-277 loop and US-74, providing easy access and egress
Close proximity to numerous public transportation options including bus, light rail and free shuttle
Walking distance to major sporting and entertainment venues including Truist Ballpark, Romare Bearden Park, Bank of America Stadium, Spectrum and the Charlotte Convention Center
Morton’s The Steakhouse
24-hour on-site security with video surveillance and access control
Conference center accommodating up to 80 people and offering conference call capabilities, audio and visual and wireless Internet
Bright Horizons, an accredited child care center with early education and development for children ranging in age from 6 weeks to 5 years
Carillon Sundries
Access to an ATM
On-site car wash and detailing services
Dry cleaning and laundry pickup and drop off services
AVAILABILITIES
Suite 305: 7,323 RSF (available 3/1/21) - $34.50
Suite 400: 6,541 RSF (spec)n - $35.50
Suite 550: 14,241 RSF – (spec) - $35.50
Suite 910: 8,219 RSF - $35.50
Suite 950: 5,043 RSF - $35.50
Suite 1000: 22,615 RSF - $35.50
Suite 1410: 1,219 RSF - $35.50
Suite 1425: 5,049 RSF - $35.50
Suite 1450: 15,067 RSF -
Suite 1600 - 2,988 RSF
Suite 1820: 2,825 RSF - $35.50
Suite 1870: 1,846 RSF - $35.50
Suite 1980: 1,410 RSF (spec) - $36.50
Suite 2040: 2,774 RSF (spec) - $36.50
Suite 2060: 2,866 RSF (spec) - $36.50
Suite 2150: 4,248 RSF - $35.50
Suite 2160: 3,180 RSF - $35.50
Suite 2170: 2,870 rsf - $35.50
Suite 2250: 4,117 RSF (available 6/1/22)
Suite 2300: 21,654 RSF – $38.00 – (available 6/1/22)
Suite 2400: 18,675 RSF – $38.00 – (available 6/1/22)
Suite 2400 MEZZ: 2,542 RSF – $38.00 – (available 6/1/22)
Details
Size
476,308 sq ft
Year Built
1991
Total Available
124,163 sq ft
Min Available
1,410 sq ft
Max Contiguous
46,988 sq ft
Lease Rate
$34.50 - $35.50