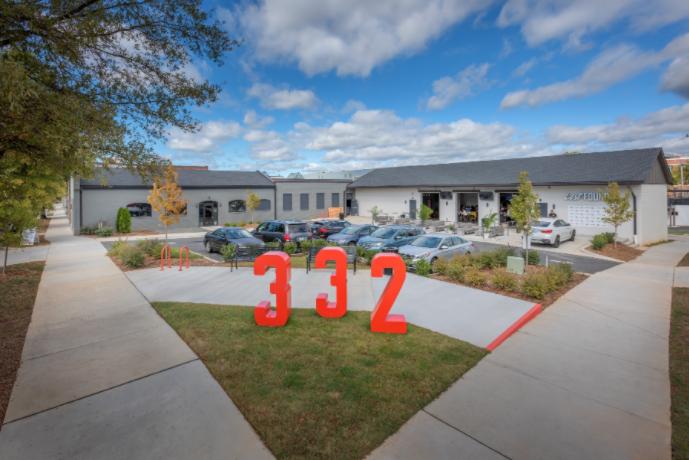
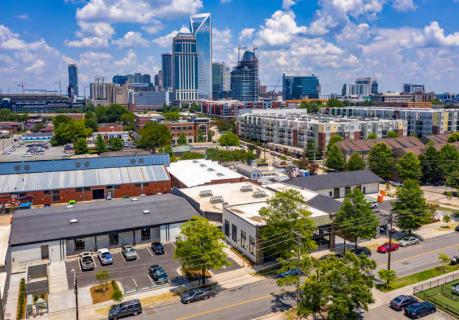
1-Mile | 3-Miles | 5-Miles | ||
---|---|---|---|---|
Total Population | 15,468 | 99,722 | 218,661 | |
Population Median Age | 33 | 36 | 35 | |
Population by Age | 0-9 Yrs | 757 (4%) | 10256 (10%) | 26905 (12%) |
10-19 Yrs | 976 (6%) | 9784 (9%) | 23293 (10%) | |
20-29 Yrs | 6369 (41%) | 23977 (24%) | 44888 (20%) | |
30-39 Yrs | 3245 (20%) | 19270 (19%) | 40612 (18%) | |
40-49 Yrs | 1583 (10%) | 10666 (10%) | 25458 (11%) | |
50-59 Yrs | 1120 (7%) | 11288 (11%) | 25075 (11%) | |
60-69 Yrs | 1091 (7%) | 8353 (8%) | 18326 (8%) | |
70+ Yrs | 328 (2%) | 6129 (6%) | 14104 (6%) | |
Median HH Income | $88,557 | $64,819 | $56,811 | |
Total Household Income | < 24K | 1092 (13%) | 9792 (21%) | 21011 (22%) |
25-49K | 1109 (13%) | 8573 (18%) | 21241 (22%) | |
50-74K | 1306 (15%) | 7046 (15%) | 14475 (15%) | |
75-99K | 1158 (14%) | 4861 (10%) | 9386 (9%) | |
100-199K | 2406 (29%) | 9480 (20%) | 17472 (18%) | |
200K+ | 1199 (14%) | 5934 (12%) | 10291 (10%) | |
Highest Education Level | No Diploma | 451 | 6679 | 18800 |
Diploma or GED | 833 | 10438 | 25521 | |
Some College | 1020 | 11374 | 27040 | |
Assoc. Degree | 522 | 3950 | 9025 | |
Bachelors Degree | 5162 | 23703 | 45476 | |
Higher Degree | 3155 | 14279 | 25576 | |
Total Housing Units | 9,775 | 52,804 | 105,990 | |
--Owner-Occupied | 2,375 | 17,870 | 39,379 | |
--Renter-Occupied | 5,895 | 27,817 | 54,496 | |
Owner-Occupied Values | < 100K | 86 | 2280 | 6441 |
100-199K | 191 | 3010 | 9032 | |
200-299K | 536 | 2921 | 6078 | |
300-399K | 513 | 2510 | 4683 | |
400-499K | 229 | 1520 | 3053 | |
500K+ | 821 | 5629 | 10092 | |
Total Working Age Population | 14,289 | 83,786 | 177,231 | |
In Work Force | 12,087 | 62,444 | 128,938 | |
Not In Work Force | 2,202 | 21,342 | 48,292 | |
Workforce Employed | 11,799 | 59,274 | 122,155 | |
Workforce Unemployed | 288 | 3,159 | 6,724 | |
Civlian Workforce | 12,087 | 62,434 | 128,879 | |
Military Workforce | 0 | 10 | 59 | |
Total Households | 8,270 | 45,687 | 93,875 | |
Family Households | 2,114 | 18,586 | 44,041 | |
Non-Family Households | 6,157 | 27,100 | 49,834 | |
Married Couple | 1,761 | 11,812 | 27,380 | |
Other Family | 353 | 6,775 | 16,661 | |
Married w/Child | 583 | 4,239 | 10,911 | |
Single Male w/Child | 13 | 551 | 1,365 | |
Single Female w/Child | 72 | 2,752 | 7,225 |
Population Change Last Two Decades - Plus Projection
2000 | % | 2010 | % | 2020 | % | 2030 | |
---|---|---|---|---|---|---|---|
North Carolina | 8,049,313 | +18 | 9,535,483 | +11 | 10,630,691 | +11 | 11,836,070 |
Cabarrus County | 131,063 | +36 | 178,011 | +22 | 216,608 | +20 | 259,075 |
Gaston County | 190,365 | +8 | 206,086 | +9 | 223,842 | +7 | 239,285 |
Mecklenburg County | 695,454 | +32 | 919,628 | +23 | 1,131,342 | +19 | 1,348,822 |
Union County | 123,677 | +63 | 201,292 | +21 | 242,657 | +25 | 302,410 |
South Carolina | 4,012,012 | +15 | 4,625,364 | +9 | 5,020,400 | +9 | 5,488,460 |
York County | 164,614 | +37 | 226,073 | +12 | 252,860 | +14 | 287,970 |
Total Working Age Population:
Total Households:
Total Working Age Population:
Total Households:
Total Working Age Population:
Total Households: