Ideal investment opportunity with mixed-use redevelopment potential for a full or partial building owner occupant.
In Middleburg Office Park
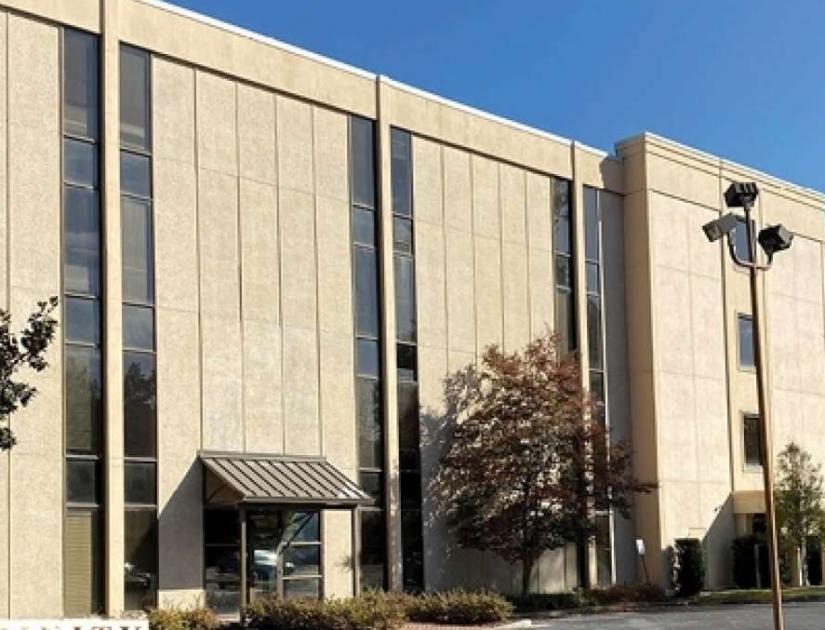
1777 St. Julian Place is located on 1.86 acres in the ±65 acre, well-branded Middleburg Business Park consisting of medical buildings, general office buildings and various residential properties. The property is zoned C-1 in the City of Columbia.
Existing Office Layout
Includes several floors with high density private office layouts. The ownership group has done selective demo work to open the space up for more open layouts.
Ample Parking
Parking Ratio: 3.8 spaces per 1,000 SF
169 parking spaces including 35 covered parking spaces with direct building access.
Professionally Managed
Building ownership has invested over $300,000 in the past 3 years replacing critical base building elements; including but not limited to new roofing system, all new HVAC equipment, and resurfacing and resealing the parking lot.
AVAILABILITIES
Suite 101 is ± 6 , 3 3 9 SF and has a covered, private entrance with a private restroom option
Suite 101 - 102 can be subdivided
First Floor Conference Center:
The St. Julian common area Conference Center is ±1,256 SF with a kitchen area. The Conference Center includes a large ±500 SF conference room and a smaller ±200 SF conference room.
No part of this information may be copied, reproduced, repurposed, or screen-captured for any commercial purpose without prior written authorization from MyEListing.
While we strive to provide the most accurate information, all listing information, and demographic data, is provided by third-parties. As such, MyEListing will not be responsible for the accuracy of the information. It is strongly recommended that you verify all information with the listing agent, and any relevant agencies, prior to making any decisions.
What is the asking price for 1777 Saint Julian Place in Columbia?
The asking price for 1777 Saint Julian Place is $2,610,000
What is the building size of this Office property in Columbia, SC?
The size of the building/unit at 1777 Saint Julian Place in Columbia is 45,340 square feet
How much land does the Columbia, SC property at 1777 Saint Julian Place include?
1777 Saint Julian Place in Columbia includes 1.860 acres of land
What kind of Office is the propery at 1777 Saint Julian Place?
The property at 1777 Saint Julian Place Columbia, SC 29204 is listed as a Professional Office property
What is the population within 1 mile of 1777 Saint Julian Place in Columbia?
The population within 1 mile of 1777 Saint Julian Place Columbia, SC 29204 is 10,184 people.
Who do I contact for questions about 1777 Saint Julian Place?
You should contact the listing agent,
William Mills, for any details regarding this commercial listing.