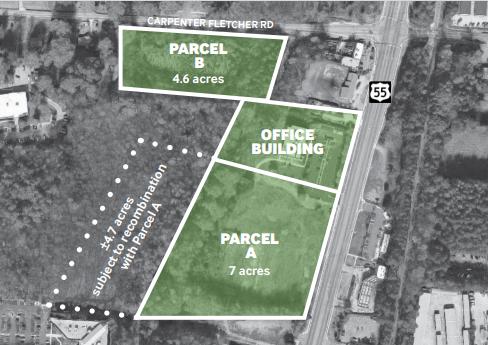
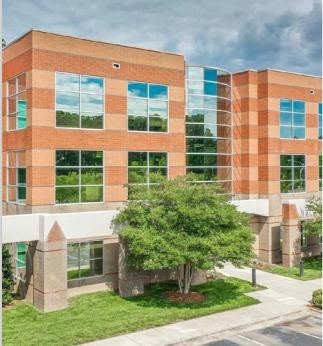
Trinity Partners is pleased to serve as the exclusive advisor on behalf of the owner of Forest Creek Office Park, an office building in Durham, North Carolina, and for the sale of two adjacent land parcels. While the building and land parcels are being packaged together, they can be purchased together or separately. The 30,648 square foot office building is fully leased to seven tenants including MindPath Support Services, Inc., DispatchHealth Management LLC, NC Virtual Academy, and Families & Communities Rising. Land parcels are ideally suited for office, flex, or retail development (±11.7 acres fronting NC Hwy. 55) and multi-family development (4.6 acres fronting Carpenter Fletcher Road).Rare stabilized office investment opportunity, 100% leasedProminent Durham location on Hwy. 55, adjacent to Meridian Corporate Center and in the path of developmentParcel A*, 11.7 acres fronting NC Hwy. 55, ideally suited for office, flex, or retail development (*subject to a recombination of ±4.7 acres, as illustrated by dotted line, with 7-acre tract fronting Hwy. 55)Parcel B, 4.6 acres fronting Carpenter Fletcher Road, ideally suited for multi-family developmentFor more information, please use link below to View confidentiality agreement and return completed agreement to eaustin@trinity-partners.com.Link: https://s3.amazonaws.com/trinity-partners.com/uploads/CONFIDENTIALITY-AGREEMENT_Forest-Creek-Office-Park-Bldg-Land-Disposition.pdf