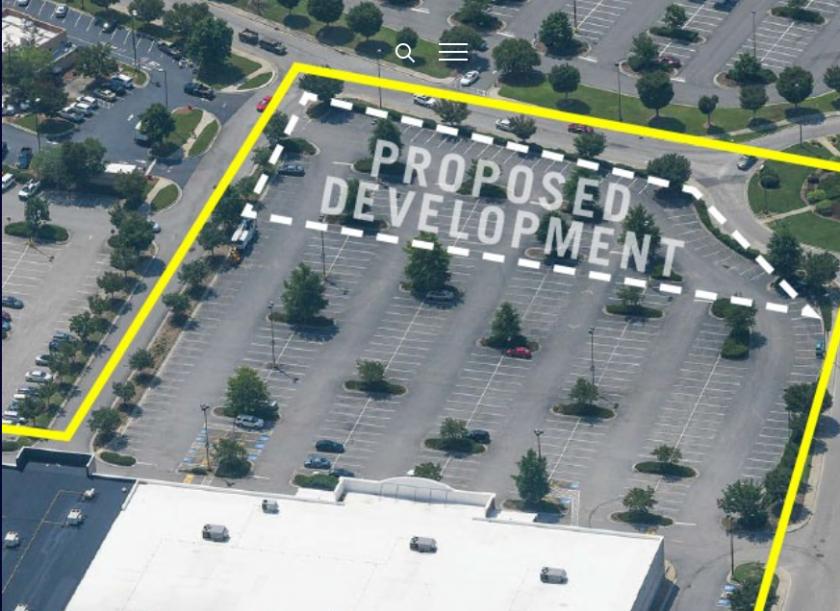
1-Mile | 3-Miles | 5-Miles | ||
---|---|---|---|---|
Total Population | 13,690 | 84,798 | 199,834 | |
Population Median Age | 33 | 36 | 37 | |
Population by Age | 0-9 Yrs | 2062 (15%) | 11204 (13%) | 25144 (12%) |
10-19 Yrs | 1545 (11%) | 10473 (12%) | 24507 (12%) | |
20-29 Yrs | 2786 (20%) | 13688 (16%) | 29502 (14%) | |
30-39 Yrs | 2213 (16%) | 13465 (15%) | 32557 (16%) | |
40-49 Yrs | 2233 (16%) | 11897 (14%) | 28211 (14%) | |
50-59 Yrs | 1381 (10%) | 10697 (12%) | 25017 (12%) | |
60-69 Yrs | 897 (6%) | 7157 (8%) | 19107 (9%) | |
70+ Yrs | 572 (4%) | 6216 (7%) | 15789 (7%) | |
Median HH Income | $43,488 | $57,574 | $68,649 | |
Total Household Income | < 24K | 1188 (22%) | 5565 (16%) | 10784 (13%) |
25-49K | 1947 (36%) | 9055 (26%) | 18132 (22%) | |
50-74K | 955 (18%) | 6436 (19%) | 14260 (17%) | |
75-99K | 591 (11%) | 4801 (14%) | 11780 (14%) | |
100-199K | 534 (10%) | 6338 (18%) | 18557 (23%) | |
200K+ | 72 (1%) | 1439 (4%) | 5971 (7%) | |
Highest Education Level | No Diploma | 1486 | 7572 | 12829 |
Diploma or GED | 2208 | 10368 | 22819 | |
Some College | 1945 | 11345 | 26069 | |
Assoc. Degree | 622 | 5083 | 11683 | |
Bachelors Degree | 1864 | 16012 | 42989 | |
Higher Degree | 645 | 6967 | 21640 | |
Total Housing Units | 5,922 | 37,240 | 87,651 | |
--Owner-Occupied | 1,478 | 16,785 | 46,238 | |
--Renter-Occupied | 3,808 | 16,848 | 33,246 | |
Owner-Occupied Values | < 100K | 323 | 1545 | 2637 |
100-199K | 767 | 7570 | 14953 | |
200-299K | 320 | 4453 | 13397 | |
300-399K | 56 | 1848 | 7342 | |
400-499K | 3 | 702 | 2739 | |
500K+ | 7 | 668 | 5170 | |
Total Working Age Population | 10,562 | 66,689 | 159,174 | |
In Work Force | 8,393 | 48,636 | 114,591 | |
Not In Work Force | 2,169 | 18,053 | 44,583 | |
Workforce Employed | 7,739 | 45,954 | 109,346 | |
Workforce Unemployed | 653 | 2,612 | 5,094 | |
Civlian Workforce | 8,393 | 48,566 | 114,440 | |
Military Workforce | 0 | 69 | 151 | |
Total Households | 5,286 | 33,634 | 79,484 | |
Family Households | 3,104 | 20,605 | 49,067 | |
Non-Family Households | 2,182 | 13,029 | 30,417 | |
Married Couple | 1,599 | 13,538 | 34,832 | |
Other Family | 1,505 | 7,067 | 14,235 | |
Married w/Child | 674 | 5,979 | 15,320 | |
Single Male w/Child | 134 | 881 | 1,752 | |
Single Female w/Child | 712 | 3,208 | 6,360 |
Population Change Last Two Decades - Plus Projection
2000 | % | 2010 | % | 2020 | % | 2030 | |
---|---|---|---|---|---|---|---|
North Carolina | 8,049,313 | +18 | 9,535,483 | +11 | 10,630,691 | +11 | 11,836,070 |
Franklin County | 47,260 | +28 | 60,619 | +16 | 70,212 | +16 | 81,204 |
Johnston County | 121,965 | +38 | 168,878 | +26 | 212,401 | +27 | 269,736 |
Wake County | 627,846 | +44 | 900,993 | +23 | 1,109,883 | +20 | 1,328,336 |
Total Working Age Population:
Total Households:
Total Working Age Population:
Total Households:
Total Working Age Population:
Total Households: