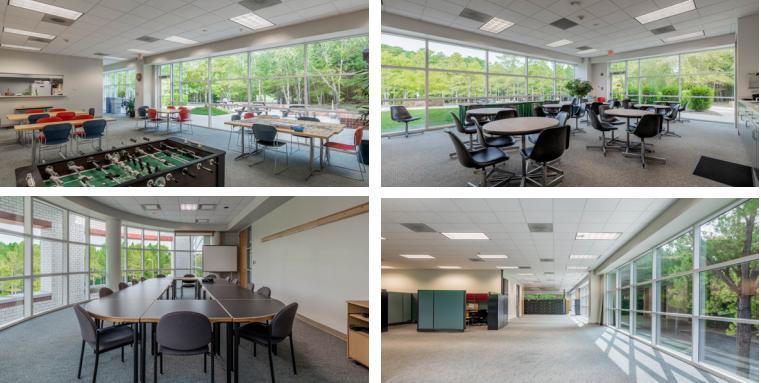
1-Mile | 3-Miles | 5-Miles | ||
---|---|---|---|---|
Total Population | 808 | 36,472 | 130,391 | |
Population Median Age | 35 | 36 | 36 | |
Population by Age | 0-9 Yrs | 124 (15%) | 4267 (11%) | 17695 (13%) |
10-19 Yrs | 83 (10%) | 3467 (9%) | 14852 (11%) | |
20-29 Yrs | 151 (18%) | 6712 (18%) | 20189 (15%) | |
30-39 Yrs | 138 (17%) | 7304 (20%) | 24905 (19%) | |
40-49 Yrs | 115 (14%) | 5240 (14%) | 18611 (14%) | |
50-59 Yrs | 69 (8%) | 3997 (10%) | 14433 (11%) | |
60-69 Yrs | 68 (8%) | 3199 (8%) | 11950 (9%) | |
70+ Yrs | 60 (7%) | 2285 (6%) | 7757 (5%) | |
Median HH Income | $79,422 | $70,245 | $76,143 | |
Total Household Income | < 24K | 47 (14%) | 1999 (12%) | 6788 (12%) |
25-49K | 52 (16%) | 3399 (20%) | 10280 (19%) | |
50-74K | 47 (14%) | 3223 (19%) | 9543 (17%) | |
75-99K | 77 (24%) | 2482 (15%) | 7632 (14%) | |
100-199K | 82 (25%) | 4003 (24%) | 14534 (26%) | |
200K+ | 13 (4%) | 1089 (6%) | 5143 (9%) | |
Highest Education Level | No Diploma | 29 | 1763 | 6474 |
Diploma or GED | 68 | 3379 | 10876 | |
Some College | 101 | 4458 | 13889 | |
Assoc. Degree | 70 | 2266 | 5896 | |
Bachelors Degree | 197 | 8228 | 29023 | |
Higher Degree | 86 | 6106 | 23796 | |
Total Housing Units | 325 | 17,066 | 57,851 | |
--Owner-Occupied | 205 | 7,735 | 27,623 | |
--Renter-Occupied | 112 | 8,460 | 26,297 | |
Owner-Occupied Values | < 100K | 4 | 142 | 1515 |
100-199K | 55 | 2957 | 7796 | |
200-299K | 98 | 3512 | 9532 | |
300-399K | 48 | 808 | 4620 | |
400-499K | 0 | 137 | 2243 | |
500K+ | 0 | 179 | 1917 | |
Total Working Age Population | 640 | 29,967 | 104,161 | |
In Work Force | 466 | 23,446 | 77,873 | |
Not In Work Force | 173 | 6,522 | 26,289 | |
Workforce Employed | 460 | 22,609 | 74,793 | |
Workforce Unemployed | 7 | 794 | 2,942 | |
Civlian Workforce | 466 | 23,404 | 77,736 | |
Military Workforce | 0 | 42 | 137 | |
Total Households | 317 | 16,195 | 53,920 | |
Family Households | 192 | 8,735 | 31,953 | |
Non-Family Households | 125 | 7,460 | 21,966 | |
Married Couple | 135 | 5,957 | 22,668 | |
Other Family | 57 | 2,778 | 9,285 | |
Married w/Child | 61 | 2,259 | 10,270 | |
Single Male w/Child | 6 | 365 | 1,154 | |
Single Female w/Child | 17 | 1,164 | 3,984 |
Population Change Last Two Decades - Plus Projection
2000 | % | 2010 | % | 2020 | % | 2030 | |
---|---|---|---|---|---|---|---|
North Carolina | 8,049,313 | +18 | 9,535,483 | +11 | 10,630,691 | +11 | 11,836,070 |
Chatham County | 49,329 | +29 | 63,505 | +22 | 77,713 | +22 | 94,920 |
Durham County | 223,314 | +20 | 267,587 | +20 | 320,322 | +14 | 366,111 |
Orange County | 118,227 | +13 | 133,801 | +11 | 148,610 | +10 | 163,699 |
Wake County | 627,846 | +44 | 900,993 | +23 | 1,109,883 | +20 | 1,328,336 |
Total Working Age Population:
Total Households:
Total Working Age Population:
Total Households:
Total Working Age Population:
Total Households: