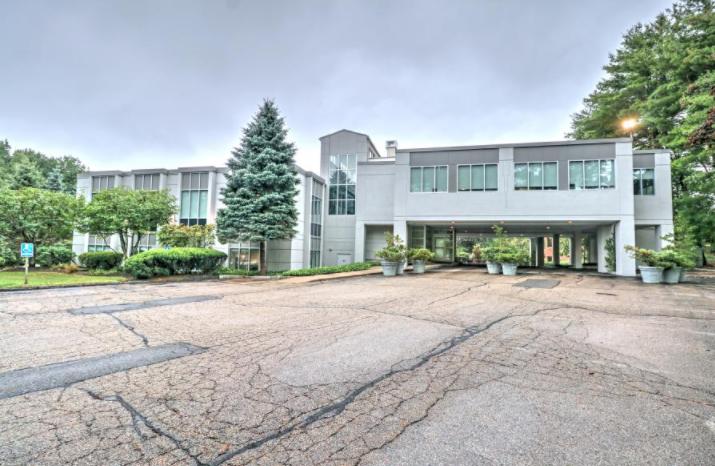
1-Mile | 3-Miles | 5-Miles | ||
---|---|---|---|---|
Total Population | 6,447 | 104,890 | 370,954 | |
Population Median Age | 41 | 41 | 39 | |
Population by Age | 0-9 Yrs | 620 (9%) | 12358 (11%) | 38619 (10%) |
10-19 Yrs | 1308 (20%) | 14159 (13%) | 45728 (12%) | |
20-29 Yrs | 479 (7%) | 9362 (8%) | 60840 (16%) | |
30-39 Yrs | 470 (7%) | 12055 (11%) | 50611 (13%) | |
40-49 Yrs | 908 (14%) | 13953 (13%) | 45908 (12%) | |
50-59 Yrs | 938 (14%) | 15087 (14%) | 47394 (12%) | |
60-69 Yrs | 838 (12%) | 13740 (13%) | 40093 (10%) | |
70+ Yrs | 887 (13%) | 14176 (13%) | 41761 (11%) | |
Median HH Income | $181,012 | $132,852 | $109,485 | |
Total Household Income | < 24K | 172 (8%) | 3744 (9%) | 18357 (13%) |
25-49K | 155 (7%) | 3753 (9%) | 15271 (10%) | |
50-74K | 147 (7%) | 3718 (9%) | 16403 (11%) | |
75-99K | 108 (5%) | 3284 (8%) | 14494 (10%) | |
100-199K | 553 (26%) | 12579 (32%) | 42759 (30%) | |
200K+ | 929 (45%) | 12067 (30%) | 32550 (23%) | |
Highest Education Level | No Diploma | 85 | 2226 | 13678 |
Diploma or GED | 313 | 8471 | 33026 | |
Some College | 309 | 7013 | 28054 | |
Assoc. Degree | 164 | 3486 | 11618 | |
Bachelors Degree | 1266 | 21145 | 75923 | |
Higher Degree | 1976 | 31605 | 96008 | |
Total Housing Units | 2,151 | 41,379 | 147,800 | |
--Owner-Occupied | 1,906 | 29,672 | 83,094 | |
--Renter-Occupied | 158 | 9,472 | 56,740 | |
Owner-Occupied Values | < 100K | 20 | 432 | 1235 |
100-199K | 16 | 274 | 903 | |
200-299K | 11 | 884 | 3786 | |
300-399K | 46 | 2147 | 8971 | |
400-499K | 61 | 3118 | 11055 | |
500K+ | 1752 | 22817 | 57145 | |
Total Working Age Population | 5,217 | 84,766 | 307,299 | |
In Work Force | 3,368 | 55,858 | 211,772 | |
Not In Work Force | 1,848 | 28,908 | 95,527 | |
Workforce Employed | 3,234 | 53,852 | 202,949 | |
Workforce Unemployed | 133 | 1,918 | 8,685 | |
Civlian Workforce | 3,367 | 55,770 | 211,634 | |
Military Workforce | 1 | 88 | 138 | |
Total Households | 2,064 | 39,144 | 139,833 | |
Family Households | 1,718 | 27,226 | 85,650 | |
Non-Family Households | 346 | 11,918 | 54,183 | |
Married Couple | 1,535 | 23,296 | 67,506 | |
Other Family | 183 | 3,929 | 18,143 | |
Married w/Child | 736 | 10,406 | 29,749 | |
Single Male w/Child | 21 | 468 | 1,603 | |
Single Female w/Child | 51 | 1,578 | 6,659 |
Population Change Last Two Decades - Plus Projection
2000 | % | 2010 | % | 2020 | % | 2030 | |
---|---|---|---|---|---|---|---|
Massachusetts | 6,349,097 | +3 | 6,547,629 | +6 | 6,933,887 | +4 | 7,225,472 |
Middlesex County | 1,465,396 | +3 | 1,503,085 | +7 | 1,613,961 | +5 | 1,686,641 |
Norfolk County | 650,308 | +3 | 670,850 | +7 | 718,394 | +7 | 765,912 |
Suffolk County | 689,807 | +5 | 722,023 | +14 | 821,840 | +10 | 900,586 |
Total Working Age Population:
Total Households:
Total Working Age Population:
Total Households:
Total Working Age Population:
Total Households: