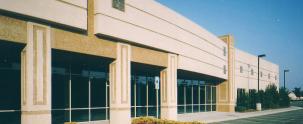
Excellent call center space. Substantial glass, space can be combined for 52,331 SF.
Substantial glass
Suite 350 is divisible to +/-5,798 SF
Suite 2560 – available 01/01/20
AVAILABILITIES
Suite 100: ±20,068 SF*
100% office with substantial glass
High-end, Class-A office finishes
Suite 250: ±14,893 SF available 1/01/20*
100% office with substantial glass
High-end, Class-A office finishes
Suites 350-500: ±37,438 SF
Divisible starting at +5,798 SF
High-end, Class-A office finishes
Currently configured as 90% office
Existing improvements (i.e. heavy power, full HVAC, etc.) are conducive to R&D/assembly use
No part of this information may be copied, reproduced, repurposed, or screen-captured for any commercial purpose without prior written authorization from MyEListing.
While we strive to provide the most accurate information, all listing information, and demographic data, is provided by third-parties. As such, MyEListing will not be responsible for the accuracy of the information. It is strongly recommended that you verify all information with the listing agent, and any relevant agencies, prior to making any decisions.
What is the building size of this commercial Flex/Office Whs property?
The size of this multi-unit property varies between 14857 - 37438 square feet
What is the population within 1 mile of 6135 Lakeview Road in Charlotte?
The population within 1 mile of 6135 Lakeview Road Charlotte, NC 28269 is 4,995 people.
Who do I contact for questions about 6135 Lakeview Road?
You should contact the listing agent,
Bill Wood, for any details regarding this commercial listing.