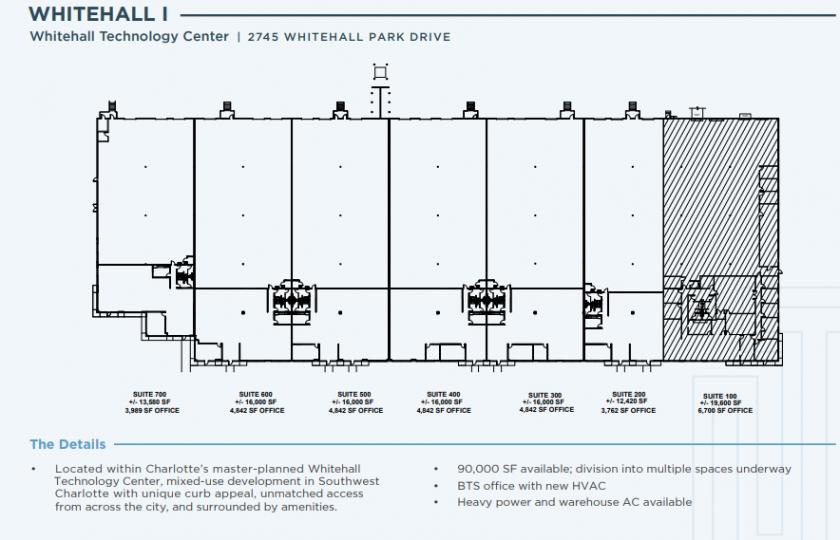
Flex-Office-Warehouse
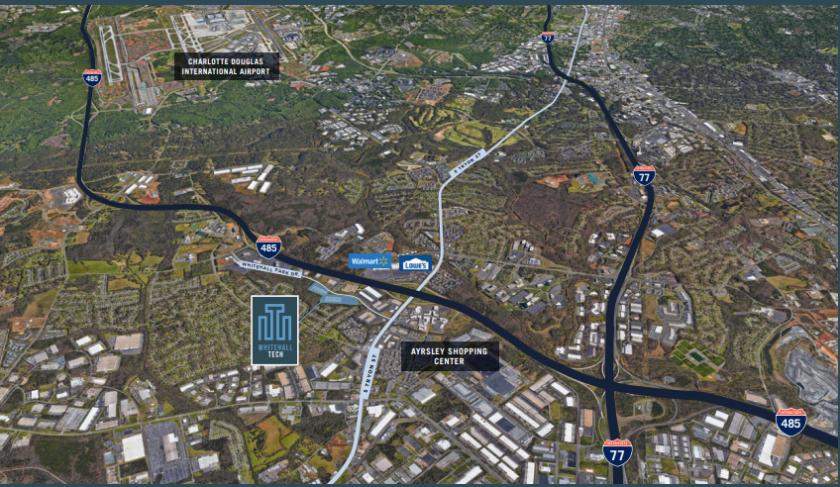
2745 Whitehall Park Drive Charlotte, NC 28273
2745 Whitehall Park Drive Charlotte, NC 28273

Details & Description
Listing Agents

Bill Wood
O: 704-295-0445
wpw@trinity-partners.com
O: 704-295-0445
wpw@trinity-partners.com
While we strive to provide the most accurate information, all listing information, and demographic data, is provided by third-parties. As such, MyEListing will not be responsible for the accuracy of the information. It is strongly recommended that you verify all information with the listing agent, and any relevant agencies, prior to making any decisions.