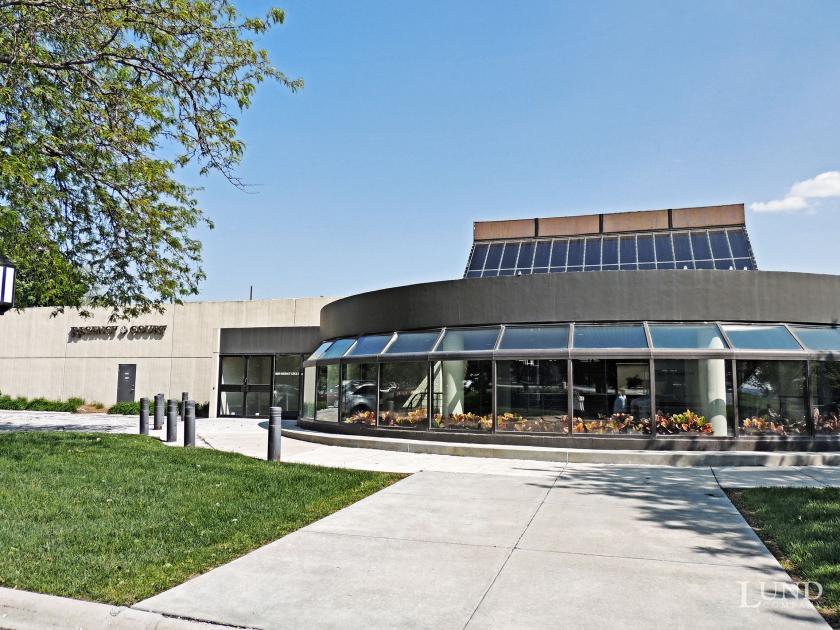
1-Mile | 3-Miles | 5-Miles | ||
---|---|---|---|---|
Total Population | 8,178 | 89,173 | 267,157 | |
Population Median Age | 41 | 39 | 38 | |
Population by Age | 0-9 Yrs | 1085 (13%) | 11539 (12%) | 35850 (13%) |
10-19 Yrs | 653 (7%) | 9754 (10%) | 31955 (11%) | |
20-29 Yrs | 1279 (15%) | 14173 (15%) | 41414 (15%) | |
30-39 Yrs | 996 (12%) | 13042 (14%) | 40802 (15%) | |
40-49 Yrs | 950 (11%) | 9173 (10%) | 29275 (10%) | |
50-59 Yrs | 962 (11%) | 10560 (11%) | 32719 (12%) | |
60-69 Yrs | 889 (10%) | 10966 (12%) | 30145 (11%) | |
70+ Yrs | 1365 (16%) | 9966 (11%) | 24997 (9%) | |
Median HH Income | $61,936 | $61,412 | $64,603 | |
Total Household Income | < 24K | 717 (18%) | 7215 (18%) | 18243 (16%) |
25-49K | 907 (22%) | 8418 (21%) | 24247 (21%) | |
50-74K | 686 (17%) | 7947 (20%) | 21768 (19%) | |
75-99K | 405 (10%) | 5203 (13%) | 16240 (14%) | |
100-199K | 743 (18%) | 7896 (19%) | 24201 (21%) | |
200K+ | 494 (12%) | 2934 (7%) | 6814 (6%) | |
Highest Education Level | No Diploma | 122 | 2826 | 10693 |
Diploma or GED | 741 | 11258 | 37272 | |
Some College | 1307 | 14077 | 40816 | |
Assoc. Degree | 415 | 4477 | 15175 | |
Bachelors Degree | 1950 | 17917 | 49574 | |
Higher Degree | 1343 | 10992 | 27175 | |
Total Housing Units | 4,195 | 42,220 | 118,262 | |
--Owner-Occupied | 1,742 | 21,193 | 66,333 | |
--Renter-Occupied | 2,211 | 18,421 | 45,180 | |
Owner-Occupied Values | < 100K | 88 | 1419 | 7924 |
100-199K | 432 | 11042 | 36381 | |
200-299K | 338 | 4318 | 13723 | |
300-399K | 272 | 1999 | 4089 | |
400-499K | 175 | 925 | 1640 | |
500K+ | 436 | 1491 | 2576 | |
Total Working Age Population | 6,658 | 71,671 | 212,177 | |
In Work Force | 4,376 | 51,152 | 153,221 | |
Not In Work Force | 2,281 | 20,519 | 58,956 | |
Workforce Employed | 4,226 | 49,352 | 147,439 | |
Workforce Unemployed | 143 | 1,629 | 5,291 | |
Civlian Workforce | 4,369 | 50,981 | 152,730 | |
Military Workforce | 8 | 170 | 491 | |
Total Households | 3,953 | 39,614 | 111,513 | |
Family Households | 2,094 | 21,703 | 65,352 | |
Non-Family Households | 1,859 | 17,911 | 46,161 | |
Married Couple | 1,614 | 16,204 | 48,550 | |
Other Family | 480 | 5,499 | 16,801 | |
Married w/Child | 568 | 6,304 | 20,119 | |
Single Male w/Child | 73 | 782 | 2,647 | |
Single Female w/Child | 222 | 2,251 | 6,896 |
Population Change Last Two Decades - Plus Projection
2000 | % | 2010 | % | 2020 | % | 2030 | |
---|---|---|---|---|---|---|---|
Iowa | 2,926,324 | +4 | 3,046,355 | -100 | |||
Pottawattamie County | 87,704 | +6 | 93,158 | -100 | |||
Nebraska | 1,711,263 | +7 | 1,826,341 | +6 | 1,943,452 | +6 | 2,053,788 |
Douglas County | 463,585 | +12 | 517,110 | +10 | 571,311 | +9 | 625,173 |
Sarpy County | 122,595 | +30 | 158,840 | +24 | 196,701 | +19 | 233,688 |
Total Working Age Population:
Total Households:
Total Working Age Population:
Total Households:
Total Working Age Population:
Total Households: