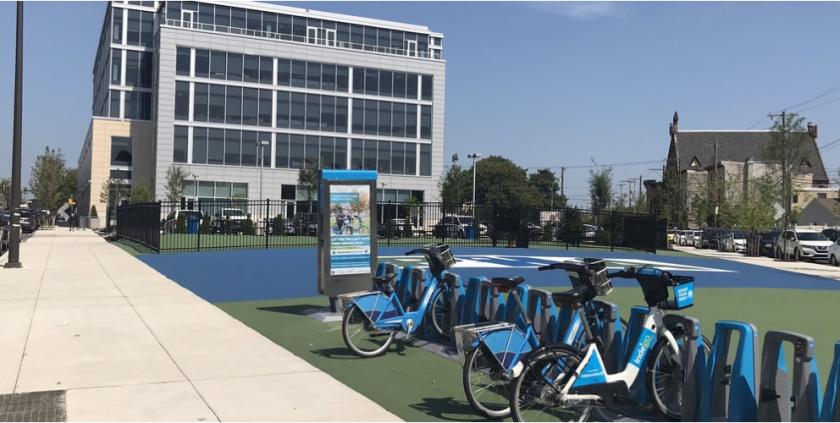
2013 Ridge is the anchor in a mix of new office, retail and housing being developed along the Ridge Avenue commercial corridor. With a modern design and large glass windows, this 5-story building contains approximately 136,000 SF of gross floor area situated on a triangular site along the East side of Ridge Avenue between Jefferson and Master Streets. The ground level offers highly visable storefront retail space. There is on-site and off-street parking, in addition to Indego bicycle sharing docks along Ridge Avenue. Its a short walk to the Broad Street subway and offers additional public transportation nearby.
Highlights
Class A Building & Infrastructure (Constructed in 2018)
Storefront Retail with Frontage on Ridge Avenue
High Ceilings with Floor to Ceiling Windows
Opportunity for Build-to-Suit
Excellent Signage Opportunity
On-Site Customer Base (including employees, clientele & visitors)
Bordered by high growth mkts includ'g Brewerytown, Francisville & Templetown
No part of this information may be copied, reproduced, repurposed, or screen-captured for any commercial purpose without prior written authorization from MyEListing.
While we strive to provide the most accurate information, all listing information, and demographic data, is provided by third-parties. As such, MyEListing will not be responsible for the accuracy of the information. It is strongly recommended that you verify all information with the listing agent, and any relevant agencies, prior to making any decisions.
What is the building size of this Office property in Philadelphia, PA?
The size of the building/unit at 2013 Ridge Avenue in Philadelphia is 136,000 square feet
What kind of Office is the propery at 2013 Ridge Avenue?
The property at 2013 Ridge Avenue Philadelphia, PA 19121 is listed as a Professional Office property
What is the population within 1 mile of 2013 Ridge Avenue in Philadelphia?
The population within 1 mile of 2013 Ridge Avenue Philadelphia, PA 19121 is 66,974 people.
Who do I contact for questions about 2013 Ridge Avenue?
You should contact the listing agent,
Lisa Edmonds, for any details regarding this commercial listing.