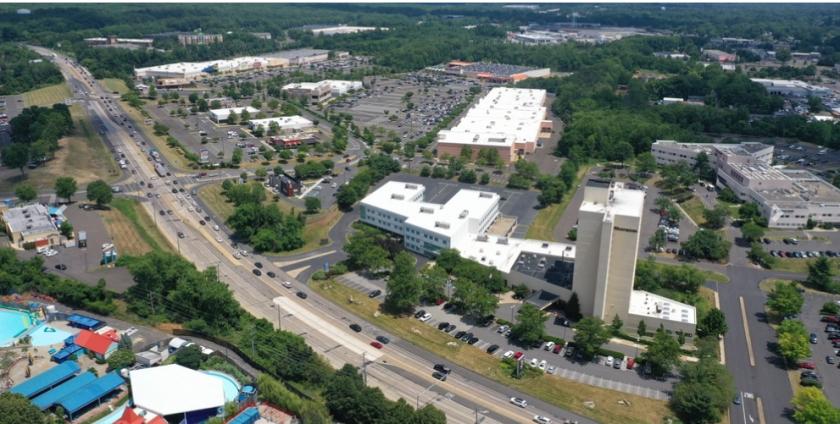
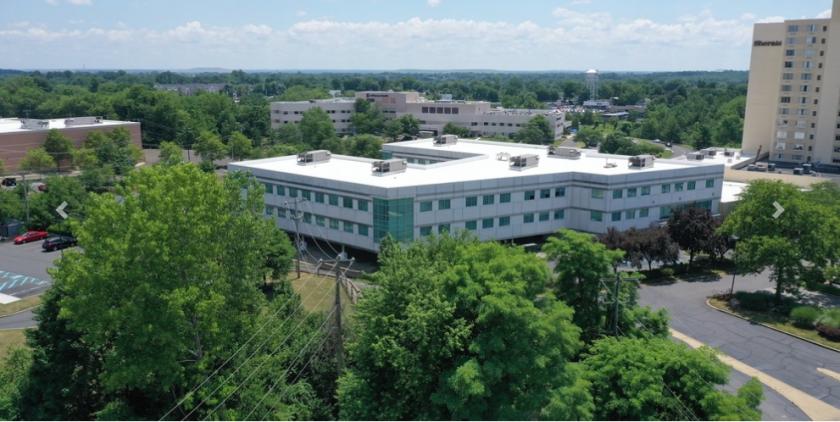
444 Oxford Valley Plaza is an ideally situated, 58,813 SF prominent three story office building located in heart of the Oxford Valley corridor in Bucks County, Pennsylvania. This exceptional property demonstrates thoughtfulness in design, construction and character. The steel frame and block construction is appointed with glass on all sides, ensuring an abundance of natural light throughout the building. The first floor includes a 2,700 SF ± turnkey medical office with surgery center. The upper floors are comprised of large, widely open floor plates offering a significant degree of flexibility in accommodating spacial programming. The property is strategically located in a highly visible location, halfway between Center City Philadelphia and Princeton New Jersey and within immediate proximity of several highway access points. The site is also within close proximity of several major medical systems. Area amenities include a significant number of local, regional and national retailers and restaurants as well as a direct connection to the adjoining Sheraton Bucks County Hotel which, in addition to guest suites offers on site dining, bar & lounge, conference facilities and a fitness center. The building is elevator served, fully sprinklered and offers ample parking.
Highlights
Available for Lease
Ideal Corporate Headquarters Opportunity
Prime Medical / Professional Office Building
58,813 SF Gross Building Area
3-Story Building w/ Large Floor Plates
Multi Level Parking w/ 310+ Parking Spaces
Elevator Served
Connected to the Sheraton Bucks County Hotel
Condo Fee Simple Ownership
Highly Visible / Accessible Location
Ideally Located for Business and Consumer Access
Close Proximity to Several Major Medical Systems
Proximity to Densely Populated Residential Trade Areas
Quality Demographic Profile
Amenities Rich Location with nearby Shopping, Restaurants and Hotels
Minutes to SEPTA Woodbourne Train Station and Yardley Train Station
Public Transportation Immediately Available
Convenient Access to US-1, US-1 Business, I-95, I-295 and PA / NJ Turnpikes