Minimum Offer / Bid: $12,000,000.00 (Twelve Million)
Minimum Deposit: 10% of Offer Price
Timing of Acceptance: Immediate (Seller reserves the right for Call for Offers)
Condition of Property Conveyance: As-Is
Property Closing: To occur not later than Q4 2020
Short Term Rent Option: Current Owner shall have the option to enter into a short term lease with the Buyer at a rental rate to be determined
Highlights
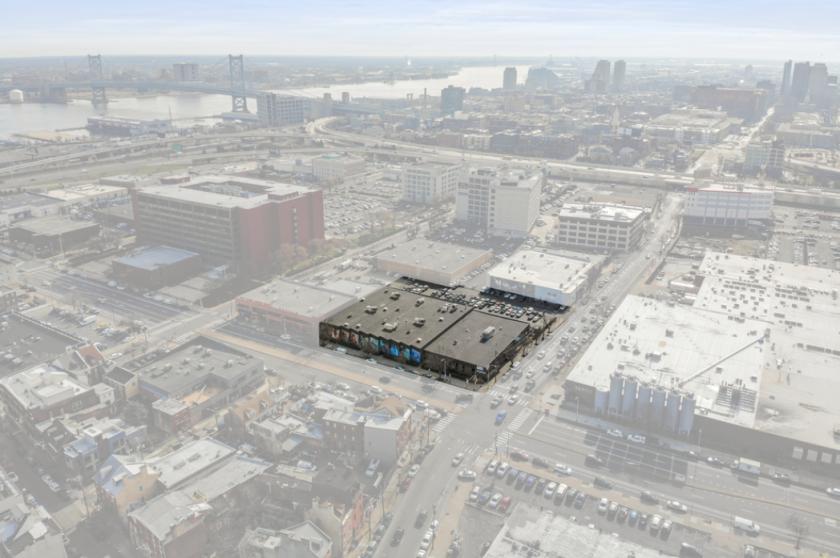
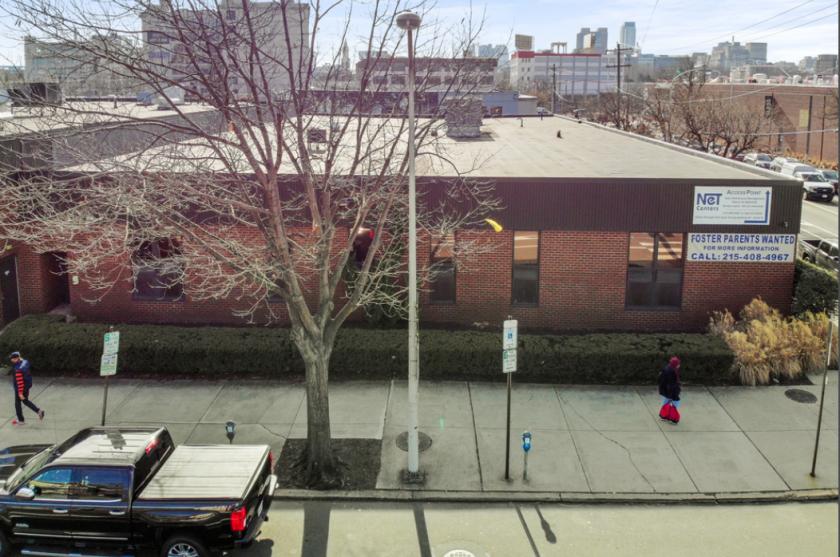
1.5-acre developable site
Location is in one of the hottest Philadelphia's markets for redevelopment
Desirable CMX-3 zoning
Corner property at recognizable intersection of two major City streets (Spring Garden St and 5th Street)
Excellent access to the two primary City Highways (I-95 and I-676)
Location is equally accessible to the Central Business District and many of the City's most popular neighborhoods
Great residential and/or retail development with by-right zoning in place
No part of this information may be copied, reproduced, repurposed, or screen-captured for any commercial purpose without prior written authorization from MyEListing.
While we strive to provide the most accurate information, all listing information, and demographic data, is provided by third-parties. As such, MyEListing will not be responsible for the accuracy of the information. It is strongly recommended that you verify all information with the listing agent, and any relevant agencies, prior to making any decisions.
What is the asking price for 499 North 5th Street in Philadelphia?
The asking price for 499 North 5th Street is $12,000,000
What is the building size of this Office property in Philadelphia, PA?
The size of the building/unit at 499 North 5th Street in Philadelphia is 36,000 square feet
How much land does the Philadelphia, PA property at 499 North 5th Street include?
499 North 5th Street in Philadelphia includes 1.500 acres of land
What kind of Office is the propery at 499 North 5th Street?
The property at 499 North 5th Street Philadelphia, PA 19123 is listed as a Professional Office property
What is the population within 1 mile of 499 North 5th Street in Philadelphia?
The population within 1 mile of 499 North 5th Street Philadelphia, PA 19123 is 43,485 people.
Who do I contact for questions about 499 North 5th Street?
You should contact the listing agent,
Brian Edmonds, for any details regarding this commercial listing.