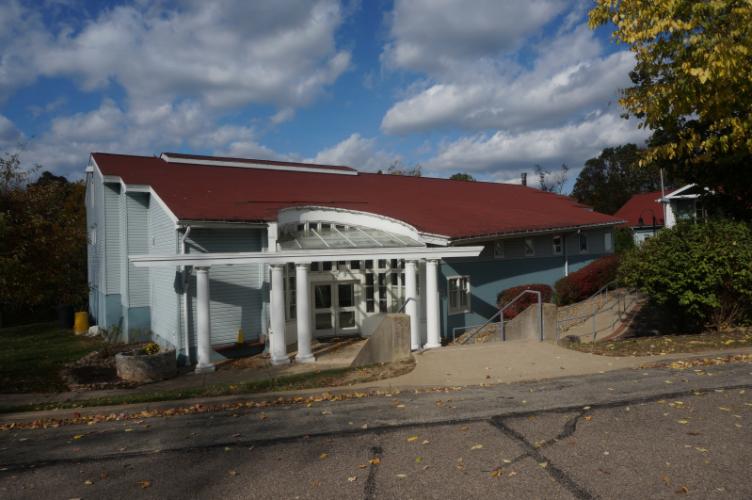
Former Winchester Thurston North Campus Private School Property. Located in The Hampton TWP School district across from Hampton Central Elementary School & Hartwood Acres. Convenient access to Rt 8 Retail, Banking, Eateries, PA Turnpike & Downtown Pittsburgh. Excellent redevelopment opportunity.
Highlights
Four free standing structures on the property
Main school building, Campus Center, Farmhouse, Pond House
7.25 Acres
RA - Zoning with Variance for School Use
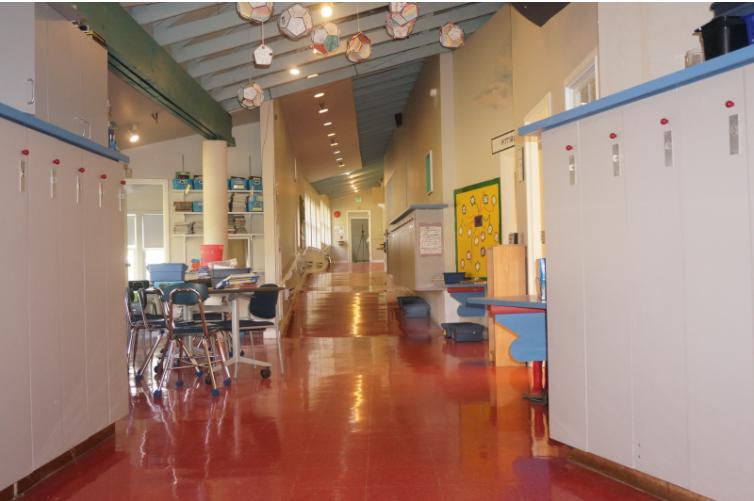
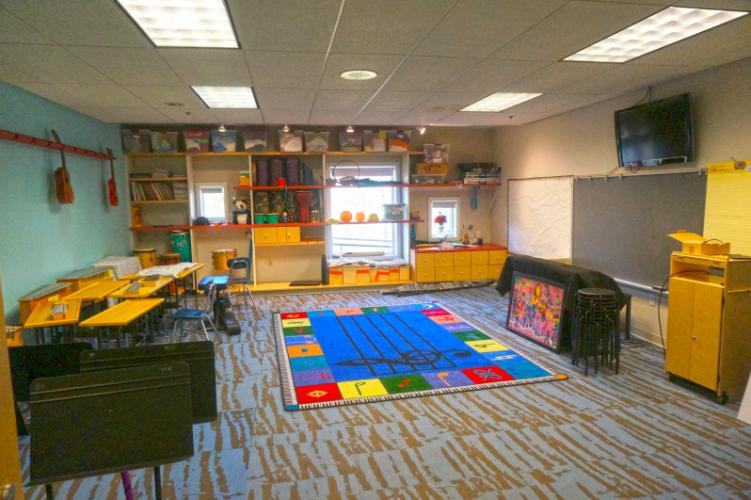
Building A: Main Bldg - Two Levels, Offices & Class Rooms
Building B: Campus Center - Gym, Arts, Music, + Kitchen Areas
Building C: Farmhouse - Class Rooms
Pond House: General Study - Sciences
No part of this information may be copied, reproduced, repurposed, or screen-captured for any commercial purpose without prior written authorization from MyEListing.
While we strive to provide the most accurate information, all listing information, and demographic data, is provided by third-parties. As such, MyEListing will not be responsible for the accuracy of the information. It is strongly recommended that you verify all information with the listing agent, and any relevant agencies, prior to making any decisions.
What is the asking price for 4225 Middle Road in Hampton Township?
The asking price for 4225 Middle Road is $1,500,000
What is the building size of this Specialty property in Hampton Township, PA?
The size of the building/unit at 4225 Middle Road in Hampton Township is 17,471 square feet
How much land does the Hampton Township, PA property at 4225 Middle Road include?
4225 Middle Road in Hampton Township includes 7.250 acres of land
What kind of Specialty is the propery at 4225 Middle Road?
The property at 4225 Middle Road Hampton Township, PA 15101 is listed as a Education/Day Care Specialty property
What is the population within 1 mile of 4225 Middle Road in Hampton Township?
The population within 1 mile of 4225 Middle Road Hampton Township, PA 15101 is 2,331 people.
Who do I contact for questions about 4225 Middle Road?
You should contact the listing agent,
Porter Scott, for any details regarding this commercial listing.