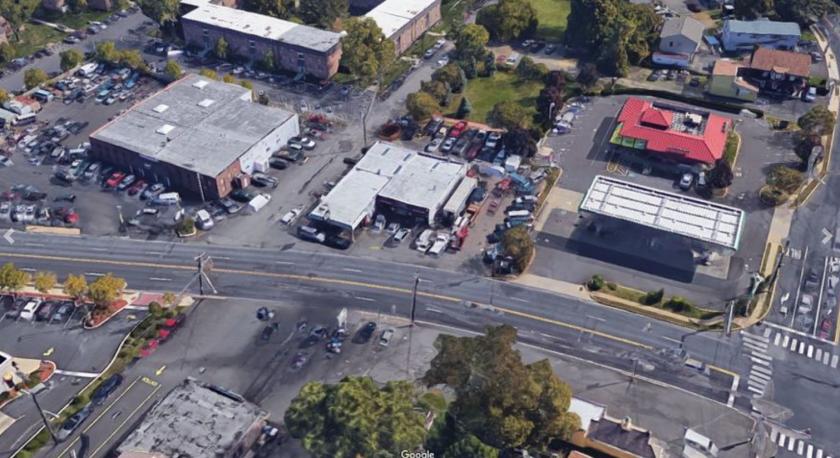
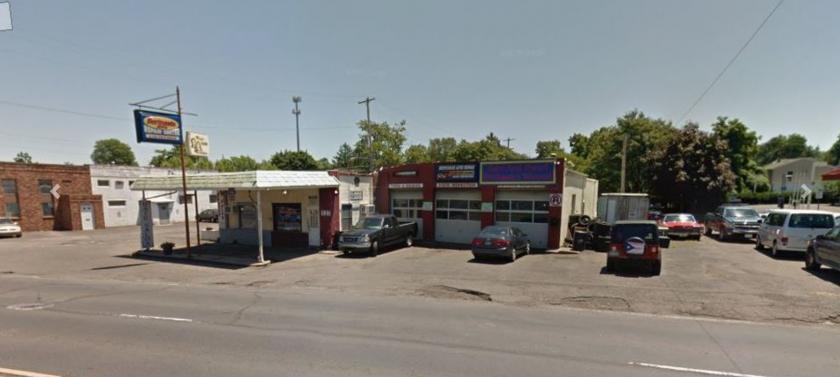
1-Mile | 3-Miles | 5-Miles | ||
---|---|---|---|---|
Total Population | 8,963 | 85,773 | 200,501 | |
Population Median Age | 40 | 41 | 41 | |
Population by Age | 0-9 Yrs | 1010 (11%) | 8990 (10%) | 20965 (10%) |
10-19 Yrs | 1167 (13%) | 10662 (12%) | 24791 (12%) | |
20-29 Yrs | 1000 (11%) | 10133 (11%) | 24328 (12%) | |
30-39 Yrs | 1204 (13%) | 10961 (12%) | 25866 (12%) | |
40-49 Yrs | 1034 (11%) | 10287 (11%) | 24383 (12%) | |
50-59 Yrs | 1560 (17%) | 13154 (15%) | 31253 (15%) | |
60-69 Yrs | 1100 (12%) | 11633 (13%) | 27045 (13%) | |
70+ Yrs | 889 (9%) | 9953 (11%) | 21869 (10%) | |
Median HH Income | $77,995 | $89,600 | $87,441 | |
Total Household Income | < 24K | 581 (16%) | 3398 (10%) | 8670 (11%) |
25-49K | 545 (15%) | 4297 (13%) | 12067 (15%) | |
50-74K | 531 (15%) | 5049 (16%) | 11887 (15%) | |
75-99K | 440 (12%) | 5017 (16%) | 10522 (13%) | |
100-199K | 1048 (30%) | 10258 (32%) | 23479 (31%) | |
200K+ | 274 (8%) | 3330 (10%) | 9097 (12%) | |
Highest Education Level | No Diploma | 477 | 4120 | 8961 |
Diploma or GED | 2299 | 19923 | 42300 | |
Some College | 1189 | 10338 | 24315 | |
Assoc. Degree | 482 | 5175 | 11894 | |
Bachelors Degree | 1213 | 12780 | 31489 | |
Higher Degree | 690 | 8688 | 23033 | |
Total Housing Units | 3,569 | 32,530 | 79,783 | |
--Owner-Occupied | 2,400 | 24,910 | 56,868 | |
--Renter-Occupied | 1,020 | 6,439 | 18,855 | |
Owner-Occupied Values | < 100K | 153 | 663 | 3047 |
100-199K | 289 | 3322 | 8250 | |
200-299K | 1225 | 11548 | 21101 | |
300-399K | 486 | 4868 | 10963 | |
400-499K | 165 | 2627 | 6903 | |
500K+ | 81 | 1882 | 6604 | |
Total Working Age Population | 7,273 | 70,507 | 164,440 | |
In Work Force | 4,900 | 47,834 | 113,251 | |
Not In Work Force | 2,372 | 22,673 | 51,189 | |
Workforce Employed | 4,694 | 45,509 | 107,752 | |
Workforce Unemployed | 206 | 2,278 | 5,370 | |
Civlian Workforce | 4,900 | 47,787 | 113,122 | |
Military Workforce | 0 | 47 | 128 | |
Total Households | 3,419 | 31,349 | 75,723 | |
Family Households | 2,340 | 23,067 | 53,369 | |
Non-Family Households | 1,079 | 8,282 | 22,354 | |
Married Couple | 1,670 | 18,153 | 41,192 | |
Other Family | 671 | 4,914 | 12,177 | |
Married w/Child | 655 | 6,660 | 15,539 | |
Single Male w/Child | 38 | 482 | 1,228 | |
Single Female w/Child | 226 | 1,534 | 4,232 |
Population Change Last Two Decades - Plus Projection
2000 | % | 2010 | % | 2020 | % | 2030 | |
---|---|---|---|---|---|---|---|
New Jersey | 8,414,350 | +4 | 8,791,894 | +4 | 9,132,700 | +4 | 9,530,900 |
Burlington County | 423,394 | +6 | 448,734 | 0 | 450,000 | +3 | 464,900 |
Mercer County | 350,761 | +4 | 366,513 | +3 | 379,000 | +5 | 397,400 |
Pennsylvania | 12,281,054 | +3 | 12,702,379 | +4 | 13,230,170 | +4 | 13,759,594 |
Bucks County | 597,635 | +5 | 625,249 | +1 | 629,420 | +1 | 637,730 |
Total Working Age Population:
Total Households:
Total Working Age Population:
Total Households:
Total Working Age Population:
Total Households: