Available immediately
• 2nd - 6,000 SF
3rd - 6,000 SF
4th - 6,000 SF
• 3rd and 4th floor can be contiguous,
connected by an internal stairway
• 12 o street parking spots available for lease
• Get 1 year of free parking - call for details
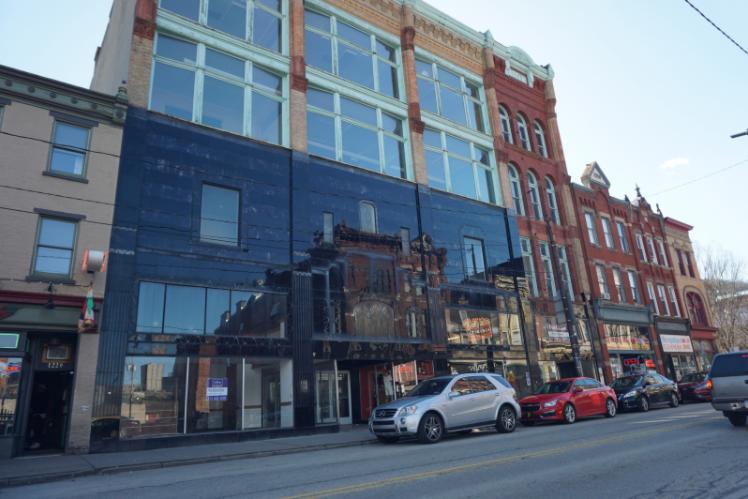
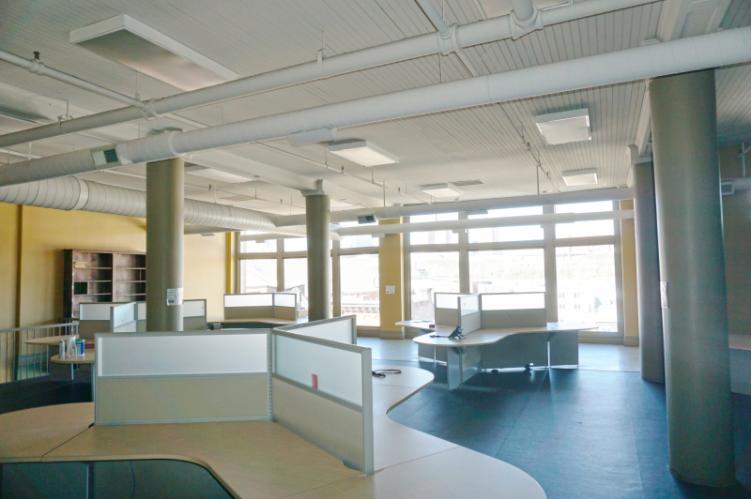
• Creative oice space with high ceilings
• Abundant natural light from floor to ceiling
windows
• Additional parking available directly across
E Carson St
• Close proximity to Downtown Pittsburgh,
Oakland, Station Square and more
No part of this information may be copied, reproduced, repurposed, or screen-captured for any commercial purpose without prior written authorization from MyEListing.
While we strive to provide the most accurate information, all listing information, and demographic data, is provided by third-parties. As such, MyEListing will not be responsible for the accuracy of the information. It is strongly recommended that you verify all information with the listing agent, and any relevant agencies, prior to making any decisions.
What is the building size of this commercial Office property?
The size of this multi-unit property varies between 6000 - 18000 square feet
What kind of Office is the propery at 1212 East Carson Street?
The property at 1212 East Carson Street Pittsburgh, PA 15203 is listed as a Professional Office property
What is the population within 1 mile of 1212 East Carson Street in Pittsburgh?
The population within 1 mile of 1212 East Carson Street Pittsburgh, PA 15203 is 26,752 people.
Who do I contact for questions about 1212 East Carson Street?
You should contact the listing agent,
AJ Pantoni, for any details regarding this commercial listing.